17" LCD Part IV: Six Panels With 16 And 20 ms
Get Tom's Hardware's best news and in-depth reviews, straight to your inbox.
You are now subscribed
Your newsletter sign-up was successful
Graph Analysis
For points of reference, we used two top-range LaCie monitors: an Electron19blueIV (a 19" CRT) and a Photon20vision (a 20" LCD).
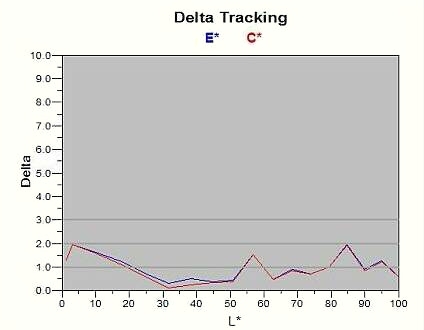
Among other things, calibration produces a DeltaE graph. This gives the difference between the color requested and the one the monitor actually produces. A DeltaE of 1 or less means calibration is perfect. There will be no noticeable difference between the original color and the end result. You only have a problem when your DeltaE = 3; at this level, the human eye can tell the difference between the two shades. LaCie reckons calibration is successful if DeltaE is 2 or less.
Below are two examples of DeltaE = 6. They show how the discrepancy increases with the brightness of the original color.
Now for the sRGB calibration results of our two monitors:
LaCie Electron19blueIV
At both 5000 K and 6500 K, all the values on the blue curve (DeltaE) are less than 2. But a look at the X-axis shows the curve starts at 1. Related to a scale of 0 (black) - 255 (white in RGB mode), this means that once the monitor is calibrated, all the colors from 2 to 255 will be perfectly displayed. However, it won't be able to display 0 and 1 blacks.
Get Tom's Hardware's best news and in-depth reviews, straight to your inbox.

