Why you can trust Tom's Hardware
Comparison Products

Today, we pit the S40G up against two of its brothers, the SX8200 Pro (Silicon Motion SM2262EN + Micron 64L TLC) and SX6000 Pro (Realtek RTS5763DL + Micron 64L TLC), as well as a few fierce mainstream competitors.
This includes the Corsair Force MP510 (Phison E12 + Kioxia 64L TLC), WD Black SN750 (in-house NVMe controller + Kioxia 64L TLC), and Samsung 970 EVO Plus 970 EVO Plus (Phoenix + 9xL TLC V-NAND).
We also threw in a few value options with the Intel SSD 660p (SM2263EN + Micron 64L QLC) and Crucial MX500 (SM2258 + Micron 64L TLC). We even included a 6TB WD Black, a 7200-RPM HDD, for good measure.
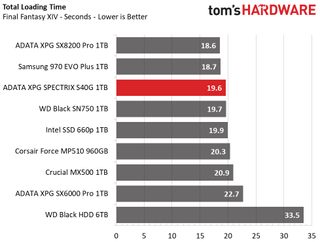
Game Scene Loading - Final Fantasy XIV
The Final Fantasy XIV StormBlood benchmark is a free real-world game benchmark that easily and accurately compares game load times without the inaccuracy of using a stopwatch.

It’s not as fast as Adata’s maxed out SX8200 Pro, nor Samsung’s 970 EVO Plus, but the S40G is still quite fast at loading game scenes. With a total load time of 19.6 seconds, the S40G scores third place overall. You load times would be nearly as fast with cheaper alternatives, though.
Transfer Rates – DiskBench
We use the DiskBench storage benchmarking tool to test file transfer performance with our own custom 50GB block of data. Our data set includes 31,227 files of various types, like pictures, PDFs, and videos. We copy the files to a new folder and then follow up with a reading test of a newly-written 6.5 GB file.


The S40G copied our 50GB folder at a rate of just under 700 MBps. This scores in fourth place, lagging the SX8200 Pro and the WD Black SN750. But, it outperforms the Corsair MP510 by over 100 MBps and is almost seven times faster than an HDD.
The drive lands in fourth place again during the read test, but the gap between it and the best, the 970 EVO Plus, is only 100MBps.
Trace Testing – PCMark 8 Storage Test 2.0
PCMark 8 is a trace-based benchmark that uses Microsoft Office, Adobe Creative Suite, World of Warcraft, and Battlefield 3 to measure the performance of storage devices in real-world scenarios.


While the S40G displayed strong performance in both of the first two application tests, it’s PCMark 8 results could use some improvement. The S40G scored a total of 5,047 points and averaged 403 MBps during its run. It ranks in eighth place and has slower average performance than the entry-level DRAMless SX6000 Pro and QLC Intel SSD 660p.
Trace Testing – SPECworkstation 3
Like PCMark 8, SPECworkstation 3 is a trace-based benchmark, but it is designed to push the system harder by measuring workstation performance in professional applications. The full suite consists of more than 30 workloads, but we've opted to only run the storage benchmark which uses only 15 of them and categorizes the results into 5 market segments for scoring: Media & Entertainment, Product Development, Life Sciences, Energy, and General Operations.


The S40G falls behind the crowd of mainstream competitors under SPECworkstation's heavy load. It ranks in fifth place and completed the benchmark in a similar time as an entry-level SSD. While it didn’t deliver high-end performance here, it still provides significantly better performance than the WD Black HDD.
Synthetic Testing - ATTO
ATTO is a simple and free application that SSD vendors commonly use to assign sequential performance specifications to their products. It also gives us insight into how the device handles different file sizes. We test at a QD of 1, which better represents consumer performance, instead of the default value of 4.


ATTO reveals why we see slower performance in PCMark and SPECworkstation: The S40G's small-file read performance is very low compared to most other NVMe SSDs. Write performance is also slower than the other mainstream drives at a QD (queue depth) of 1, which is an important metric because it relates directly to the snappiness of the drive. The S40G's write performance is comparable to entry-level SSDs.
Synthetic Testing - iometer
iometer is an advanced and highly configurable storage benchmarking tool that vendors often use to measure the performance of their devices.


While ATTO showed weaker-than-average sequential performance at QD1, the drive reached 3.5/3.0 GBps read/write speeds under heavier loads. And QD1 random performance proved to be quite high, although write performance was still slower than some competitors and peak 4K random read performance came in at SATA-like levels.
Sustained Sequential Write Performance
Official write specifications are only part of the performance picture. Most SSD makers implement a pseudo SLC cache buffer, which is a fast area of SLC-programmed flash that absorbs incoming data. Sustained write speeds can suffer tremendously once the workload spills outside of the pSLC cache and into the "native" TLC or QLC flash. We use iometer to hammer the SSD with sequential writes for 15 minutes to measure both the size of the pSLC buffer and performance after the buffer is saturated.


Like many SSDs, the Spectrix S40G features a write cache to absorb drive writes at high speed, but performance degrades after extended writing. While testing the empty drive, the S40G wrote at a rate of 2.2GB/s for a total of 377GB before its performance degraded. But it displayed extremely inconsistent results after the performance dropped. At the worst it would write at 4-6 MBps for a second or two before it would pick back up, but soon fall again. This resulted in an average speed of roughly 250 MBps after it exhausted the write cache.
Power Consumption
We use the Quarch HD Programmable Power Module to gain a deeper understanding of power characteristics. Idle power consumption is a very important aspect to consider, especially if you're looking for a new drive for your laptop. Some SSDs can consume watts of power at idle while better-suited ones sip just milliwatts.
Average workload power consumption and max consumption are two other aspects of power consumption, but performance-per-watt is more important. A drive might consume more power during any given workload, but accomplishing a task faster allows the drive to drop into an idle state faster, which ultimately saves power.


Overall, the Spectrix S40G is quite power efficient. It averaged about 175-180 MBps-per-watt, similar to the SX8200 Pro. It consumed just under four watts on average, and peaked at 5.4, which is less than the MX500.
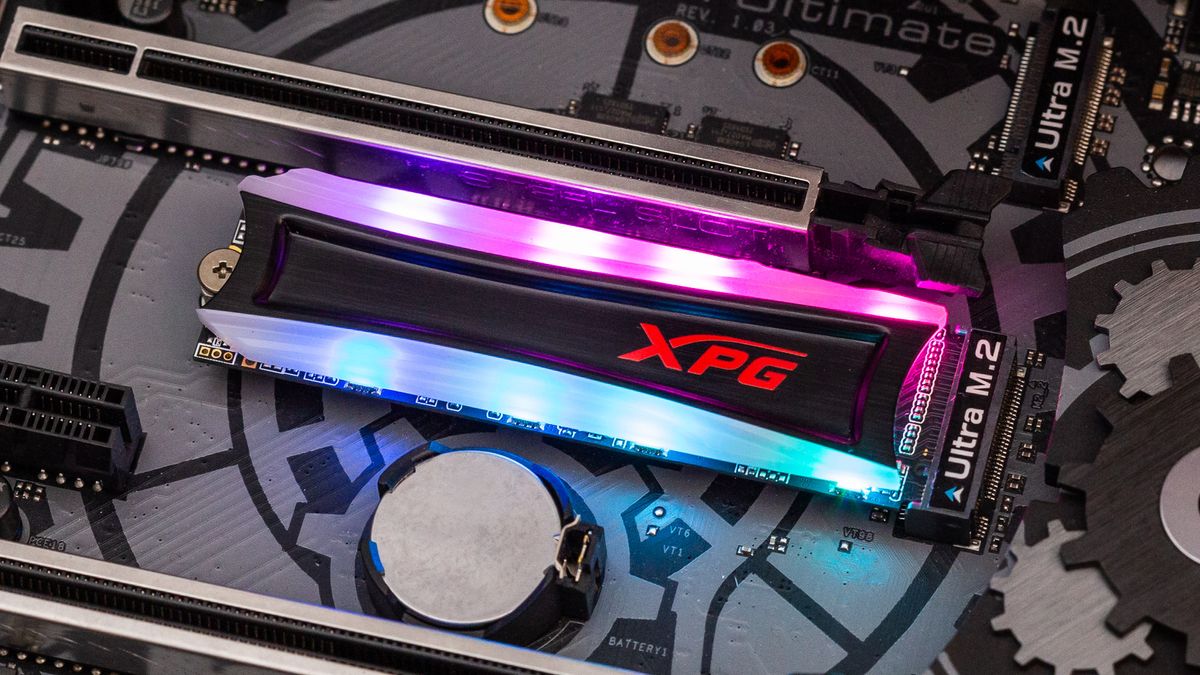
Unlike some RGB SSDs we have tested in the past, the LED lights don’t consume much power at all. They also don’t overdraw power at idle, which can cause heating issues. The difference in power consumption with the lights on and off is just under 100mW. Also, idle power consumption is average for a PCIe 3.0 x4 device when ASPM is disabled, but when enabled, the SSD doesn't fall into lower power modes after idling.
MORE: Best SSDs
MORE: How We Test HDDs And SSDs
MORE: All SSD Content

Sean is a Contributing Editor at Tom’s Hardware US, covering storage hardware.
