Why you can trust Tom's Hardware
Protection Features
Check out our PSUs 101 article to learn more about PSU protection features.
|
Protection Features | |
|
OCP |
12V: 71.4A (133.22%), 12.082V 5V: 28.3A (141.5%), 4.976V 3.3V: 27.3A (136.5%), 3.295V 5VSB: 6.3A (210%), 4.991V |
|
OPP |
870.1W (133.86%) |
|
OTP |
✓ (112°C @ 12V Heat Sink) |
|
SCP |
12V: ✓ 5V: ✓ 3.3V: ✓ 5VSB: ✓ -12V: ✓ |
|
PWR_OK |
Proper operation |
|
NLO |
✓ |
|
SIP |
Surge: MOV Inrush: NTC Thermistor & Bypass Relay |
The OCP at +12V is close to the ideal setting (130%), while on the minor rails, it is pretty high. The minor rails don't have to handle high loads, so it is not necessary to have such high OCP triggering points. Finally, the OPP is close to 130%, so it provides satisfactory protection.
The over-temperature protection has a low triggering point, given the PSU's semi-passive operation, but we didn't encounter any shutdowns during our load tests under high operating temperatures.
DC Power Sequencing
According to Intel’s most recent Power Supply Design Guide (revision 1.4), the +12V and 5V outputs must be equal to or greater than the 3.3V rail at all times. Unfortunately, Intel doesn't mention why it is so important to always keep the 3.3V rail's voltage lower than the levels of the other two outputs.

DC Power Sequencing Scope Shots


The 3.3V rail is lower than the other two in all three tests, so everything is fine here.
Cross Load Tests
To generate the following charts, we set our loaders to auto mode through custom-made software before trying more than 25,000 possible load combinations with the +12V, 5V, and 3.3V rails. The deviations in each of the charts below are calculated by taking the nominal values of the rails (12V, 5V, and 3.3V) as point zero. The ambient temperature during testing was between 30 to 32 degrees Celsius (86 to 89.6 degrees Fahrenheit).
Load Regulation Charts

Load Regulation Charts


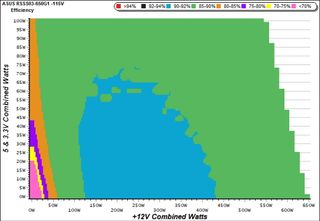
Efficiency Chart

Ripple Charts
The lower the power supply's ripple, the more stable the system will be and less stress will also be applied to its components.

Ripple Suppression Charts


Infrared Images
We apply a half-load for 10 minutes with the PSU's top cover and cooling fan removed before taking photos with a modified FLIR E4 camera able to deliver an IR resolution of 320x240 (76,800 pixels).

IR Images


Despite the conditions that we applied, the temperatures remain at low enough levels. The large heat sinks do an excellent job and efficiently handle the not so high thermal loads.
MORE: Best Power Supplies
MORE: How We Test Power Supplies
MORE: All Power Supply Content
Current page: Protection Features, DC Power Sequencing, Cross-Load Tests and Infrared Images
Prev Page Load Regulation, Hold-Up Time, Inrush Current, Efficiency and Noise Next Page Transient Response Tests, Timing Tests, Ripple Measurements and EMC Pre-Compliance Testing
Aris Mpitziopoulos is a contributing editor at Tom's Hardware, covering PSUs.

TSMC is in a heated tussle with a golf course to build the most advanced 2nm chip plant on the planet

OpenAI reportedly builds custom AI chips as it embraces AMD — company also abandons plans to build its own fabs

Ryzen AI 300 takes big wins over Intel in LLM AI performance — up to 27% faster token generation than Lunar Lake in LM Studio
