Why you can trust Tom's Hardware
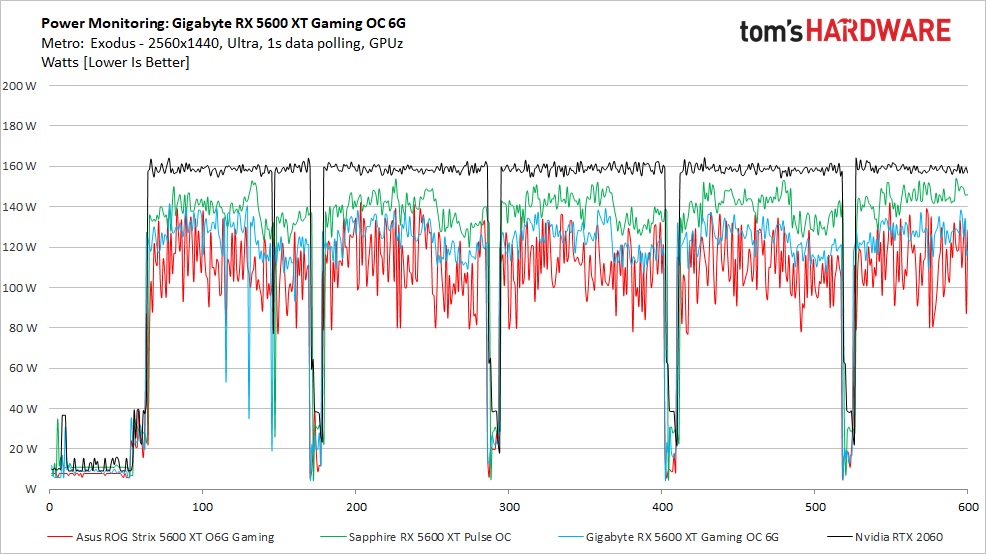
We used GPUz logging to measure each card's power consumption with the Metro: Exodus benchmark running at 2560 x 1440 using the default Ultra settings. The test card is warmed up prior to testing and started after settling to an idle temperature (after about 10 minutes). The benchmark is looped a total of five times, which yields around 10 minutes of testing. In the charts you will see a few blips in power use that are a result of the benchmark ending one loop and starting the next.
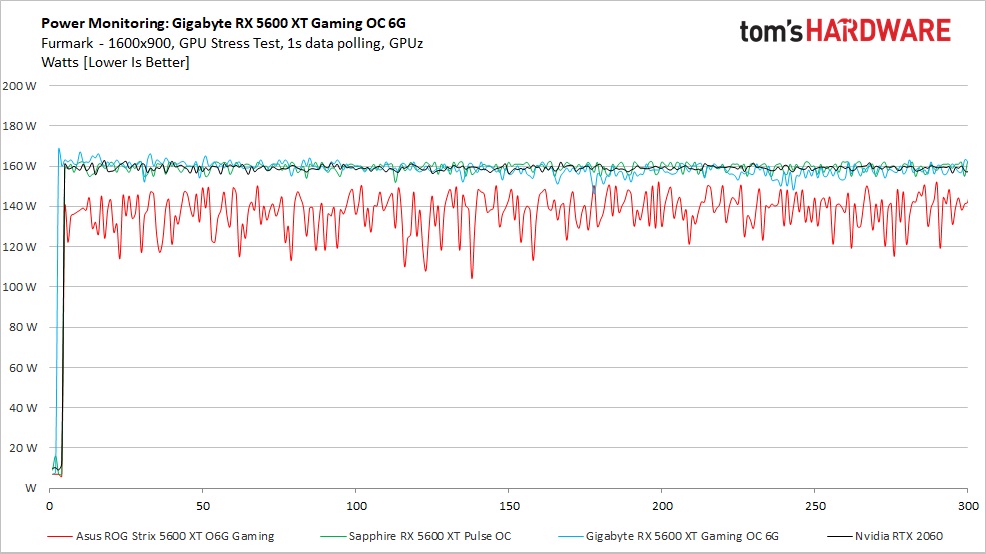
We also used FurMark to capture worst-case power readings. Although both Nvidia and AMD consider the application to be a "power virus," or a program that deliberately taxes the components beyond normal limits, the data we can gather from it offers useful information about a card's capabilities outside of typical gaming loads. Not that we recommend GPU mining, but that's one application where power use can track close to FurMark, sometimes even exceeding it.
Power Draw
Looking at the power chart for gaming, the Gigabyte Gaming OC (light blue) averaged 122W. That puts it between the Asus (111W) and the Sapphire (140W). The RTX 2060 uses the most power here, averaging nearly 160W, well over the next highest power use card (Sapphire).
The Gigabyte RX 5600 XT Gaming OC's latest BIOS (FAO) that we are using specifies a 180W limit, but the card isn't getting anywhere close to that during this set of tests. There is ample headroom to overclock further without going over the power limit.
Our FurMark results show both the Sapphire and Gigabyte cards averaging close to 160W (158W and 159W respectively). Compare this to the Asus card, which varied wildly in comparison, averaging only 137W. The Gigabyte card came closer to the listed power limit, but with AMD cards and GPUz logging, only GPU power is listed. The memory subsystems and fans take up the remainder of the allowance.
Temperatures, Fan Speeds and Clock Rates
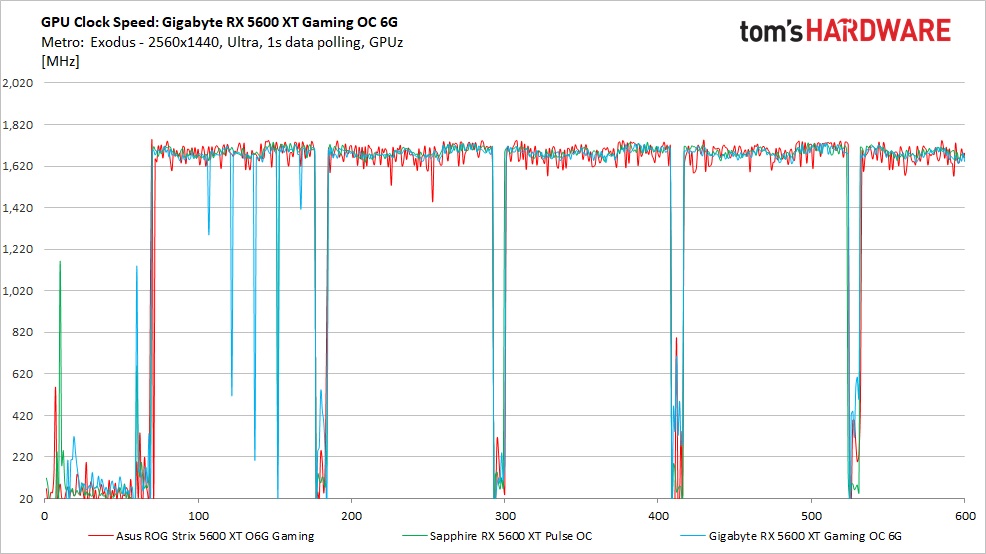
In order to see how each video card behaves, like the power testing, we use GPUz logging in one-second intervals to capture data. As with testing for power, testing for these items is also done by looping the Metro: Exodus benchmark five times running at 2560x1440 and ultra settings.
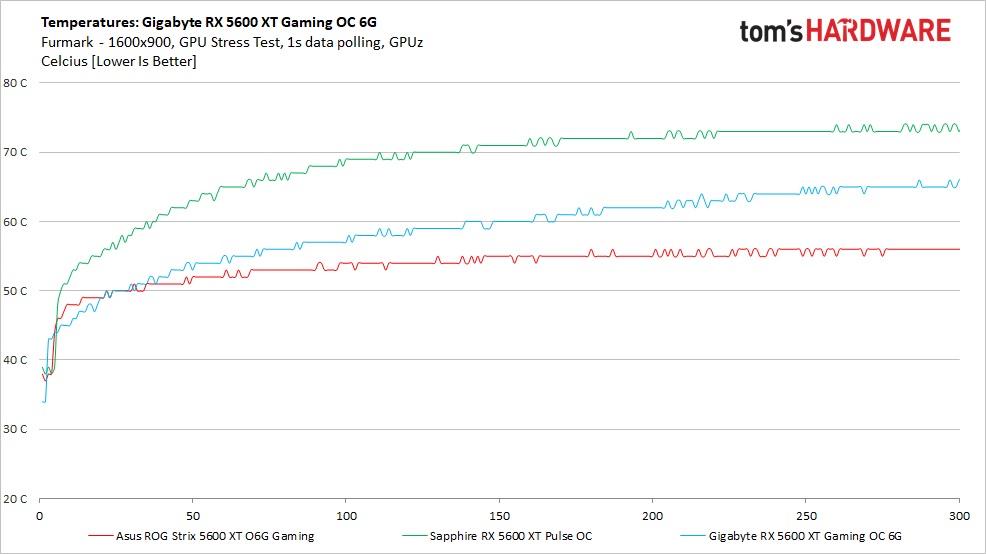
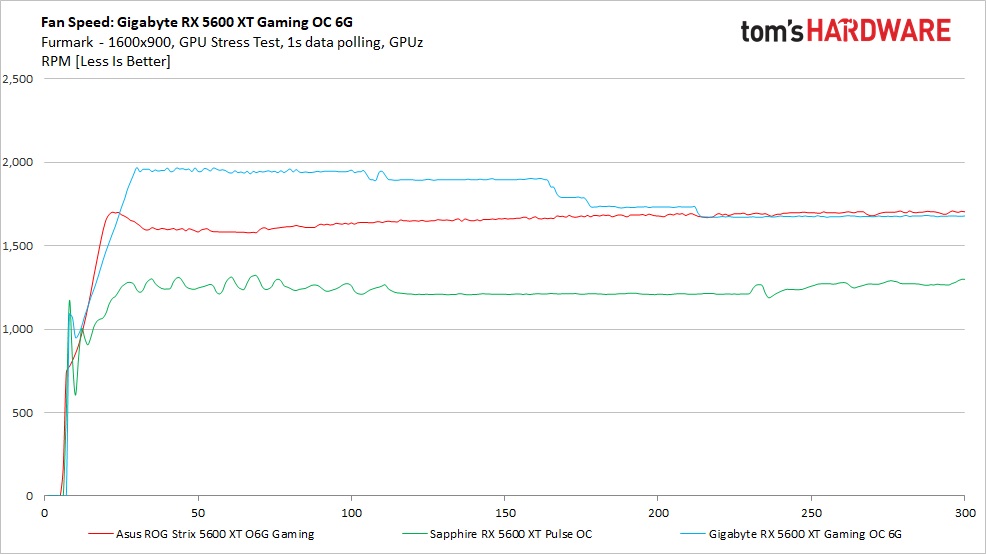
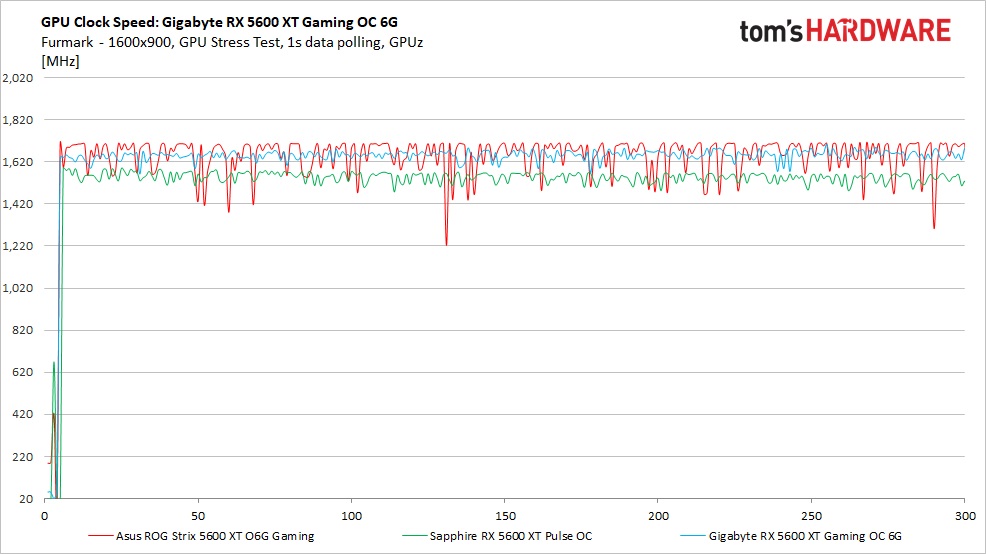
Additionally, we also used FurMark to capture some of the data below, which offers a more consistent load and uses slightly more power, regardless of the fact that the clock speeds and voltages are limited. These data sets give insight into worst-case situations along with a non-gaming workload.
Get Tom's Hardware's best news and in-depth reviews, straight to your inbox.
Gaming
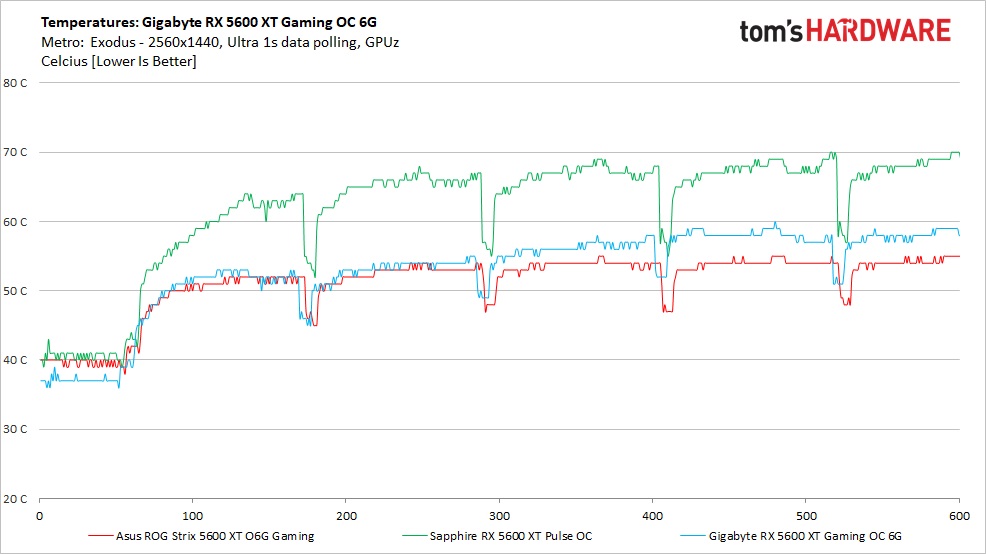
Looking at the temperature chart for gaming, The Gigabyte Gaming OC again performed between the Sapphire and Asus. The Asus card with its low power use and large cooler ended up the coolest, peaking around 56 degrees Celsius. The Gigabyte card and its Windforce 3 cooler peaked at 60 degrees Celsius using the default fan curve. The result is well within operating specifications.
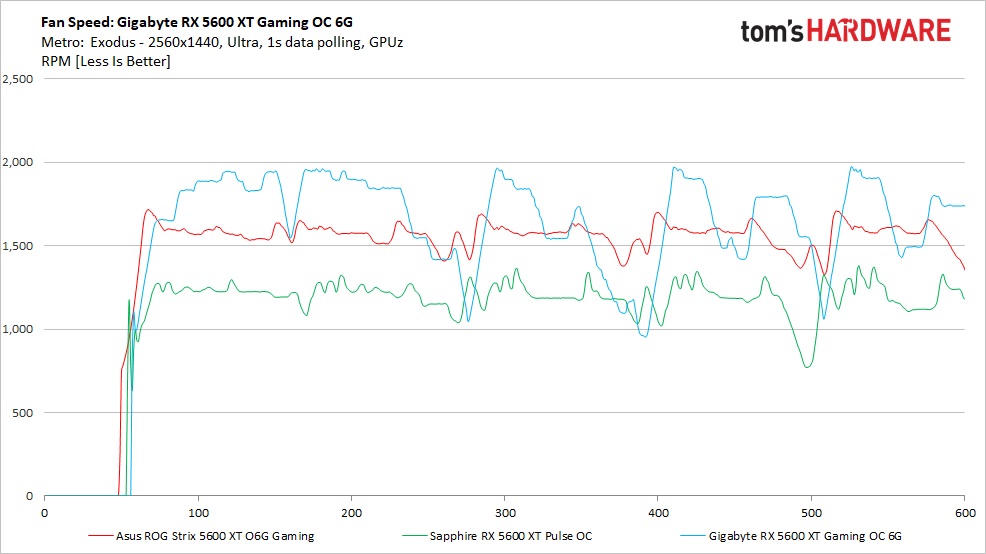
The corresponding fan speeds were all over the map. Once the game was running and the fans spun up, we saw speeds from 1,000 RPM up to 2,000 RPM. That's the largest difference we've recorded among all the cards we've captured data on. During testing, the cooler wasn't loud, but you could hear the fan speed changing here and there throughout.
With more stable loads (remember Exodus is looped five times with gaps between each run), the fan speeds did stabilize. If this phenomenon happens in the games you play and it bothers you, you can adjust the fan curve through the Aorus Engine software. Overall, the Windforce 3 cooler does a very good job of managing thermals and does so quietly.
Clock speeds on the Gigabyte card averaged 1,687 MHz during game testing. This is a few MHz less than the Sapphire (1,693 MHz) while the Asus averaged 1,682 MHz. Game clocks for the Gigabyte are listed at 1,670 MHz—we are getting that and a little bit more. The AMD boost clock remains, so far, unreachable. I prefer Nvidia's method of listing boost clocks more as a typical minimum, rather than how it's listed on current AMD cards where it's a maximum.
FurMark
Temperatures during FurMark testing ended up a lot higher with the Gigabyte card peaking at 66 degrees Celsius. This result still landed the Gigabyte in between the warmer running Sapphire (74 degrees Celsius) and cooler running Asus (55 degrees Celsius). There's nothing to worry about here. Even with the higher power draw, the card was still well within operating parameters, which is a testament to the Windforce 3 cooler.
Fan behavior did change when using FurMark. Our Gigabyte Gaming OC ramped up promptly to 1,900 RPM and then slowly stepped down as the card adjusted its voltage and clock speeds to fit within the power limit. During this testing, the fan speed was a lot more stable with the more consistent load and remained quiet throughout.
During FurMark testing, the Gigabyte's core clock averaged 1,643 MHz dropping only 40 MHz, similar to how the Asus card responded. The Sapphire dropped 150 MHz throttling a lot more than the other two cards. This alludes to having more headroom before power limit throttling begins and leaves room for overclocking without running into that limit as easily as you can on other models.
MORE: Best Graphics Cards
MORE: Desktop GPU Performance Hierarchy Table
MORE: All Graphics Content
Current page: Power Consumption, Fan Speeds, Clock Rates and Temperature
Prev Page Performance Results: 2560 x 1440 (Medium) Next Page Software: Aorus Engine
Joe Shields is a staff writer at Tom’s Hardware. He reviews motherboards and PC components.
-
King_V Interesting that the fan speeds were higher than that of the Sapphire Pulse, yet the conclusion has "less apparent noise" relative to the Pulse.Reply
And, by the graphs, kept things several degrees cooler.
I think that this Gigabyte model might beat out the Pulse on which one I choose when I do the GPU upgrade for my son's computer. -
AlistairAB ReplyKing_V said:Interesting that the fan speeds were higher than that of the Sapphire Pulse, yet the conclusion has "less apparent noise" relative to the Pulse.
And, by the graphs, kept things several degrees cooler.
I think that this Gigabyte model might beat out the Pulse on which one I choose when I do the GPU upgrade for my son's computer.
Gigabyte can have wacky fan behaviour married to good fans. I usually just set a fixed rpm and call it a day with them, as their zero rpm mode can be bad. Same as Zotac. If you want good zero rpm modes, you have to buy MSI usually. -
g-unit1111 I got the XFX Thicc II 5600XT and I've been pretty pleased with it so far. It's good to see AMD upping their GPU game after losing to NVIDIA for so long.Reply -
Nick_C Reply
Can you please provide a link to that card for sale new at $150?IceQueen0607 said:How does this compare to the MSI GTX 1660 Ti Gaming X?
Given that the GTX 1660 Ti is $150 cheaper, for a small percentage performance improvement It's not really worth the buy?
(given that the 5600XT MSRP is $300) -
You misunderstood. I didn't say the GTX 1660 Ti was $150 new, I said it was $150 less than the RX 5600 XT. I'm in Australia, so prices are AUD.Reply
-
Nick_C Reply
Without stating that the $ being referred to is AUD, not USD, context was lacking - as the default meaning of $ on an international site is almost always USD.IceQueen0607 said:You misunderstood. I didn't say the GTX 1660 Ti was $150 new, I said it was $150 less than the RX 5600 XT. I'm in Australia, so prices are AUD. -
Wow! I actually didn't quote any prices, only saying that it was $150 LESS. The context was supposed to be that it was 25% less than the AMD card. Anyway, if the lack of an A in front of the $ is misleading, I'll stick with percentages.Reply
-
Like I said "Wow!"Reply
The question regardless of what the currency is "If the GTX 1660 Ti is cheaper, is the RX 5600 XT worth the purchase if the performance increase is in the low single digits? I haven't seen any comparisons for those two cards, and I don't trust userbenchmark for performance.
Disappointing that a question about whether or not a card is worth purchasing has come down to a chastening for a missing 'A' in the question :! -
Nick_C Reply
The "25% less" was completely absent from the post quoted - thanks for adding that important detail.IceQueen0607 said:Wow! I actually didn't quote any prices, only saying that it was $150 LESS. The context was supposed to be that it was 25% less than the AMD card. Anyway, if the lack of an A in front of the $ is misleading, I'll stick with percentages.
I'd also expect that new hardware attracts a vendor premium due to initial supply / demand levels. The 1660Ti is probably well down that curve by now whereas the 5600XT is a relatively new release and prices will be on the high side for a while. -
King_V Replyg-unit1111 said:I got the XFX Thicc II 5600XT and I've been pretty pleased with it so far. It's good to see AMD upping their GPU game after losing to NVIDIA for so long.
Wasn't the cooler (or shroud) on the Thicc II problematic for thermals? Or at least it was for the 5700 or 5700XT? I was given to understand that there was some redesign of it, and possibly an exchange program XFX offered... and also why they went to the Thicc III. Kinda going from memory here, though.
