Why you can trust Tom's Hardware
Intel Core i9-10900K All-Core Turbo Boost and Power Consumption
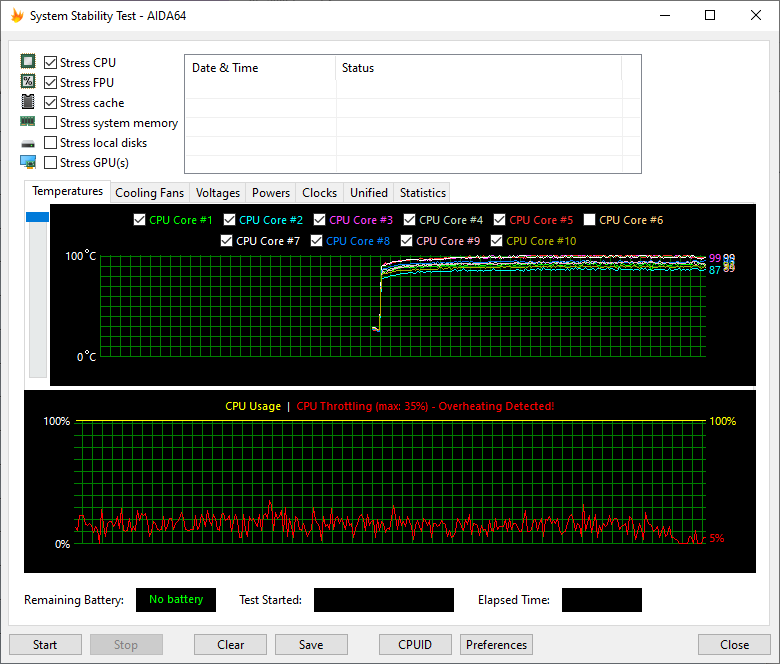
With AMD nipping at its heels, Intel decided to basically overclock its Core i9-10900K right out of the box. The resulting power consumption measurements are surprising, even for us jaded folks that test the world's fastest and hottest x86 processors for a living.
Intel uncorked its peak power consumption limits, know as PL2 (Power Level 2), by discarding its old limit of 1.25x of the base TDP rating (PL1 - Power Level 1). This exposes more performance while maintaining a 'controllable' amount of thermal output, but it also conjures up images of AMD's infamous FX-9590 processor – especially when we see the impact.
Intel set its official new PL2 watermark at a 250W TDP, which is double the 125W PL1 rating, and recommends that motherboard makers keep boost activity limited to 56 second bursts (Tau). However, motherboard vendors are free to exceed all of these limits at stock settings if they feel their product can handle the increased voltages, current, and heat.
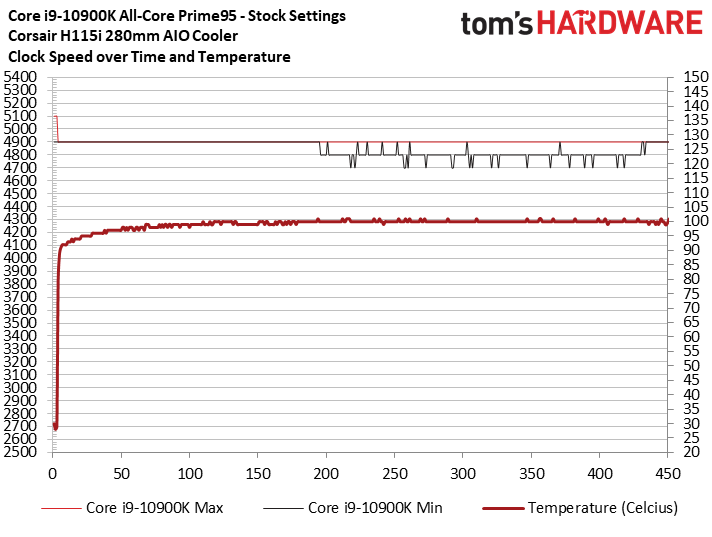
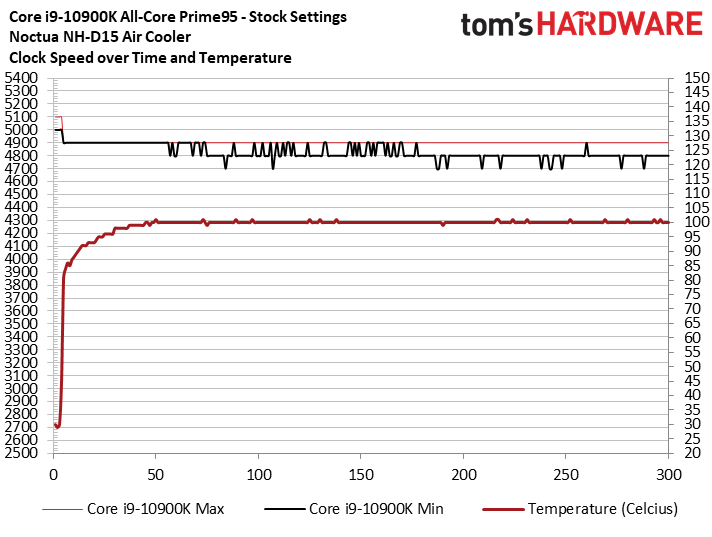
While Intel designed its 250W limit to keep thermals 'manageable' with a wide variety of cooling solutions, most motherboard vendors feed the chip up to ~330W of power at stock settings, leading to hideous power consumption metrics during AVX stress tests. Feeding 330W to a stock processor on a mainstream motherboard is a bit nuts, but it enables higher all-core frequencies for longer durations, provided the motherboard and power supply can feed the chip enough current, and your cooler can extract enough heat.
To find the power limit associated with our chip paired with the Gigabyte Aorus Z490 Master motherboard, we ran a few Prime95 tests with AVX enabled (small FFT). During those tests, we recorded up to 332W of power consumption when paired with either the Corsair H115i 280mm AIO watercooler or a Noctua NH-D15S air cooler. Yes, that's with the processor configured at stock settings. For perspective, our 18-core Core i9-10980XE drew 'only' 256W during an identical Prime95 test.
As you can see in our chart above, which measures the maximum frequency and temperature from any given core at a per-second granularity (100ms polling), temperatures (thick red line, right axis) quickly accelerated to 100C during the Prime95 test, and stayed there. Meanwhile, the frequencies (left axis) of the hottest cores dropped from the all-core 4.9 GHz down to 4.7 or 4.8 GHz as the processor engaged its throttling mechanisms to protect itself. Naturally, the air cooled configuration suffered more.
It's noteworthy that Intel positions its all-core 4.9 GHz frequency as a new Thermal Velocity Boost that only engages if the processor is below 70C, but as we can see here, the motherboard completely ignores that temperature limit. In fact, even though we're only showing the highest measurement from each of the eight cores, our logs indicate that individual cores still boosted to 4.9 GHz even when they were at 99C. At times, they also remained at 5.0 GHz when the core reached 100C, too, albeit for very short periods. That's right at the Intel-specified temperature limit.
It's surprising to see the sheer amount of power consumed (and heat generated) by the Core i9-10900K, but it's important to keep perspective. There's a stark difference between the power consumed during stress testing applications that serve as a power virus, like the Prime95 test we ran above, and the power consumption you'll see during everyday use with the majority of 'normal' applications. Those workloads include stressful multi-threaded applications like Blender and AVX-powered HandBrake distributions.
In fact, we often don't include Prime95 power measurements in our standard CPU reviews, largely because there is a massive disconnect between this extremely rigorous stress test and the power consumption and thermal load generated by most real-world applications, as we'll show below.
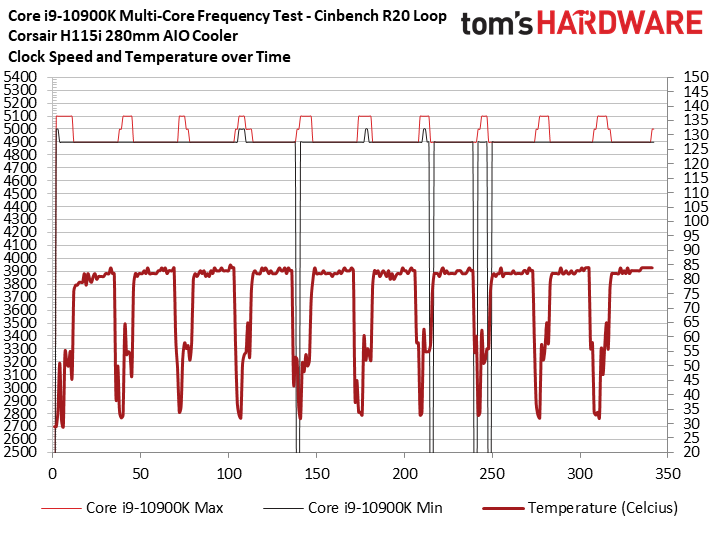
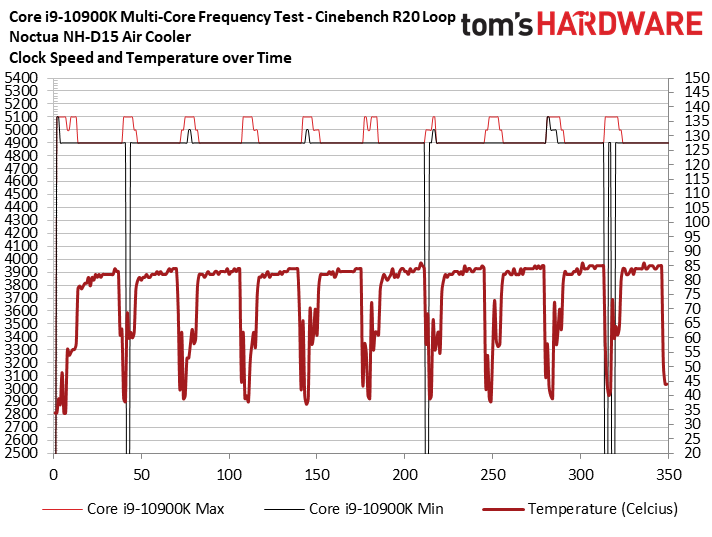
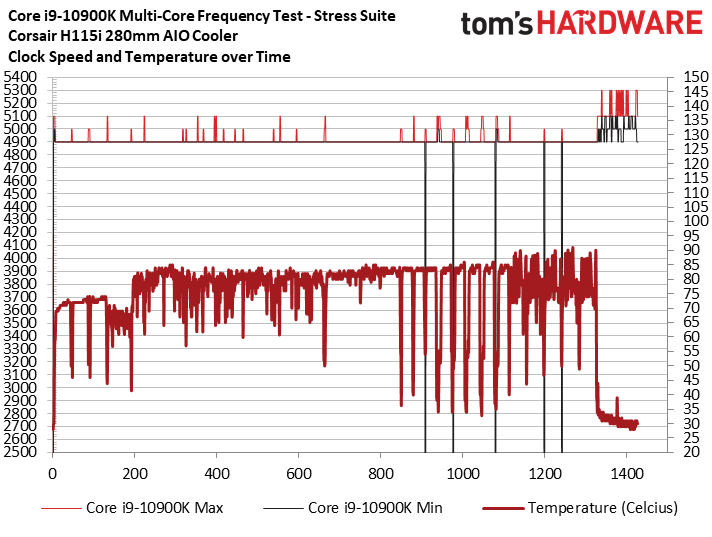
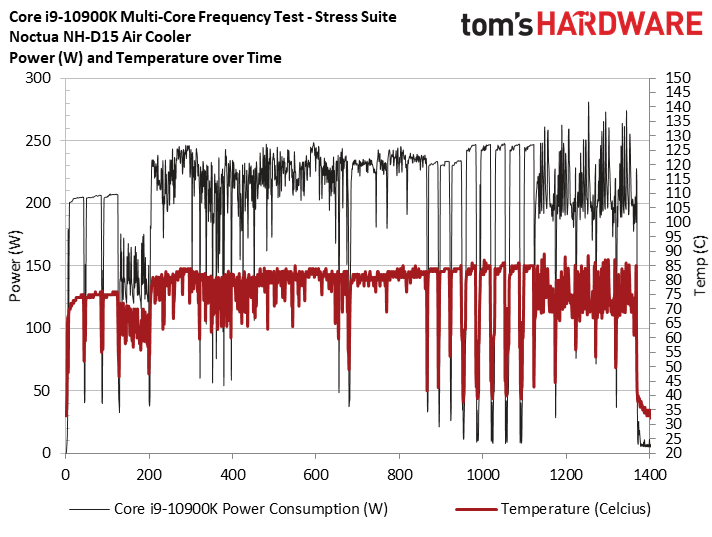
Here we ran two series of tests to measure power consumption, thermal output, and clock rates during heavy real-world all-core loads. First, we kicked off ten multi-threaded Cinebench R20 benchmarks in rapid succession. In the first two charts, we can see both the Corsair H115i and the Noctua NH-D15 handle the workload with no throttling (the downward spikes occur during idle periods between runs), and temps hover in the 85C range when the processor is under full load. These workloads consume ~250W (right at Intel's recommended PL2 value) during operation. That's about 80W lower than the Prime95 stress test. The underlying R20 engine supports AVX, AVX2, and AVX-512, but this benchmark doesn't hit the chip quite like other AVX-equipped applications, so we moved on to more demanding work.
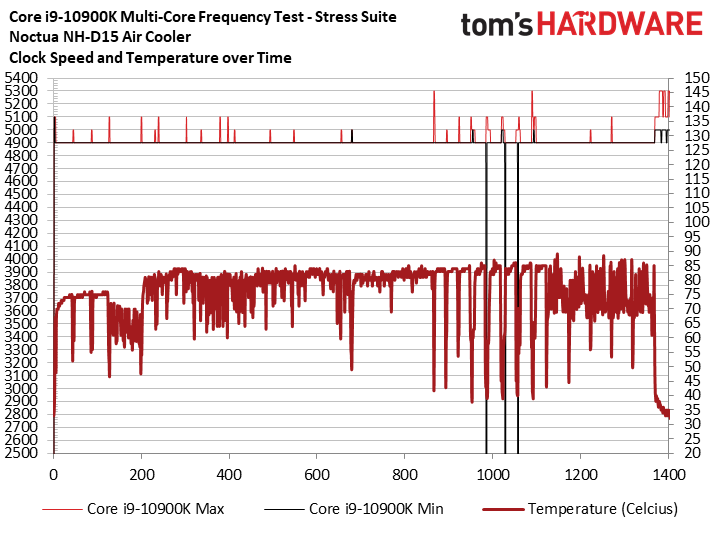
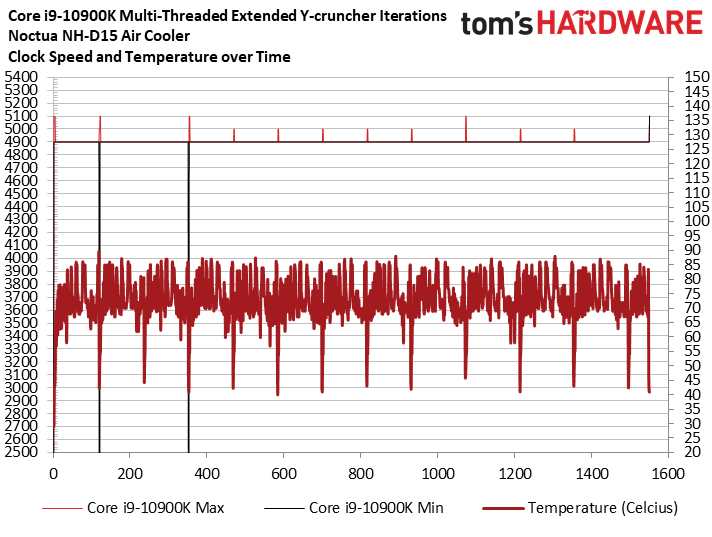
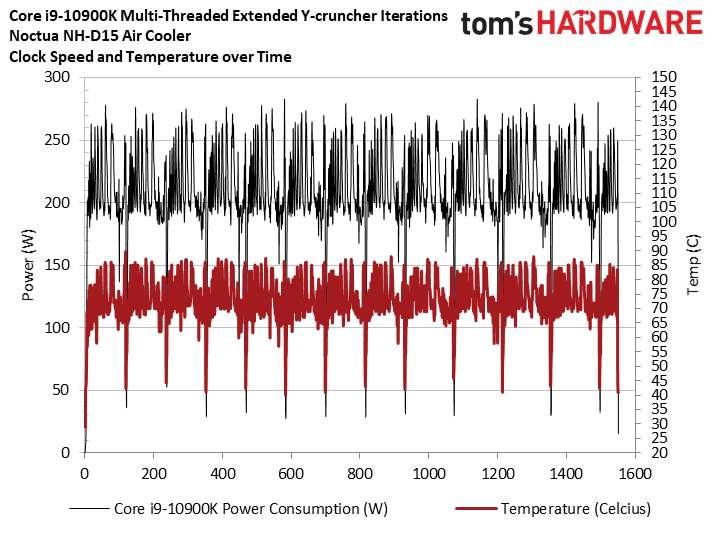
We swapped over to our 'stress suite,' which is an extended string of heavier applications that stress the chip more fully. Again, we topped the chip with the H115i and NH-D15, but stepped through multiple instances of the corona ray-tracing benchmark, x265 HandBrake rendering tests, POV-Ray multi-threaded benchmarks, Cinebench R20 runs, and finally five iterations of the AVX-intensive threaded y-cruncher.
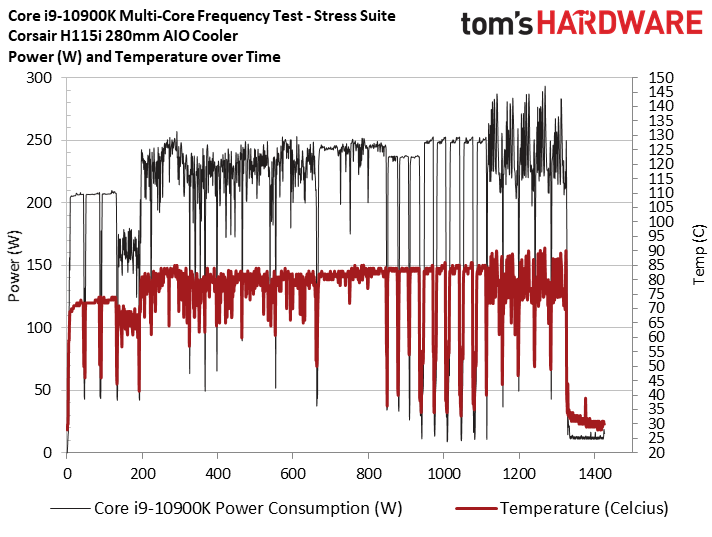
Overall, these are among the more demanding threaded tests in our suite, and temperatures peaked at ~92C with the H115i, and ~85C with the Noctua air cooler. Surprisingly, because of its lower overall temperatures, the air cooler appears to perform better in this test. That would be quite the feat considering that we recorded peak power consumption at ~280W during the test run.
However, we plotted power over the course of the run (slides five and six) and noticed that the chip drew more power when paired with the H115i cooler (~293W peak), particularly during the five y-cruncher tests at the end of the test. That's despite the fact that neither setup reached the 100C temperature limit. We also recorded better y-cruncher scores with the H115i cooler (~20% delta), but it was the lone test that suffered from performance degradation.
Aside from swapping the coolers, all other configurable parameters remained consistent for these tests., including clock rates. That clearly shows the importance of using an extremely strong cooler to unlock the full performance of the chip. We're not sure if this condition will present itself when we test with other motherboards, but we'll dive deeper in the coming days.
In the meantime, we ran another extended y-cruncher session with the DH-15, this time calculating more digits per run (last slide). Again, the chip remained comfortably below the throttle point, indicating that an air cooler could be somewhat feasible for the chip, provided you select an expensive and rather bulky model. However, you could pay the price of reduced performance in some workloads. We did run our suite of application benchmarks and games with the air cooler, and y-cruncher was the only benchmark that suffered significantly reduced performance. We're following up with more testing, stay tuned.
Intel Core i9-10900K Lightly-Threaded Turbo Boost and Thermals
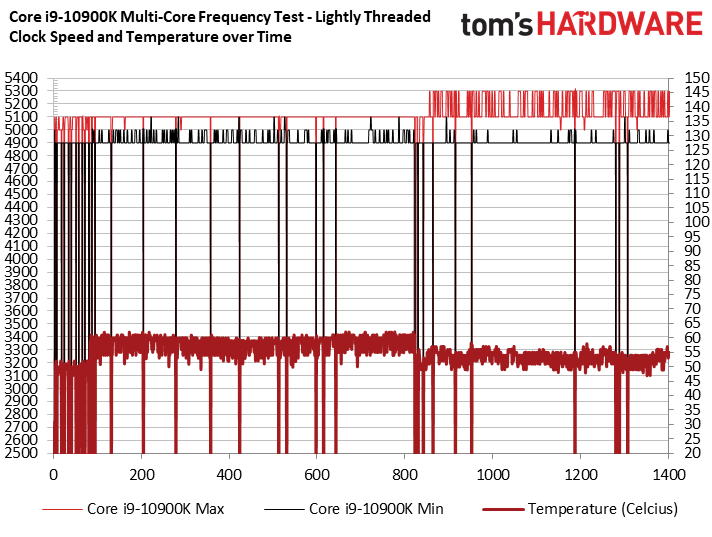
Intel's new Thermal Velocity Boost brings the promise of single-core 5.3 GHz boosts, so we ran our standard frequency test for lightly-threaded workloads (methodology here). We recorded several spikes to 5.3 GHz during the tail end of the test during the VRMark benchmark. These boosts only occured when the processor was under 70C, so it appears that while the 70C limit is ignored for all-core workloads, the feature works correctly for single-core boosts.
Intel Core i9-10900K Power Consumption and Efficiency
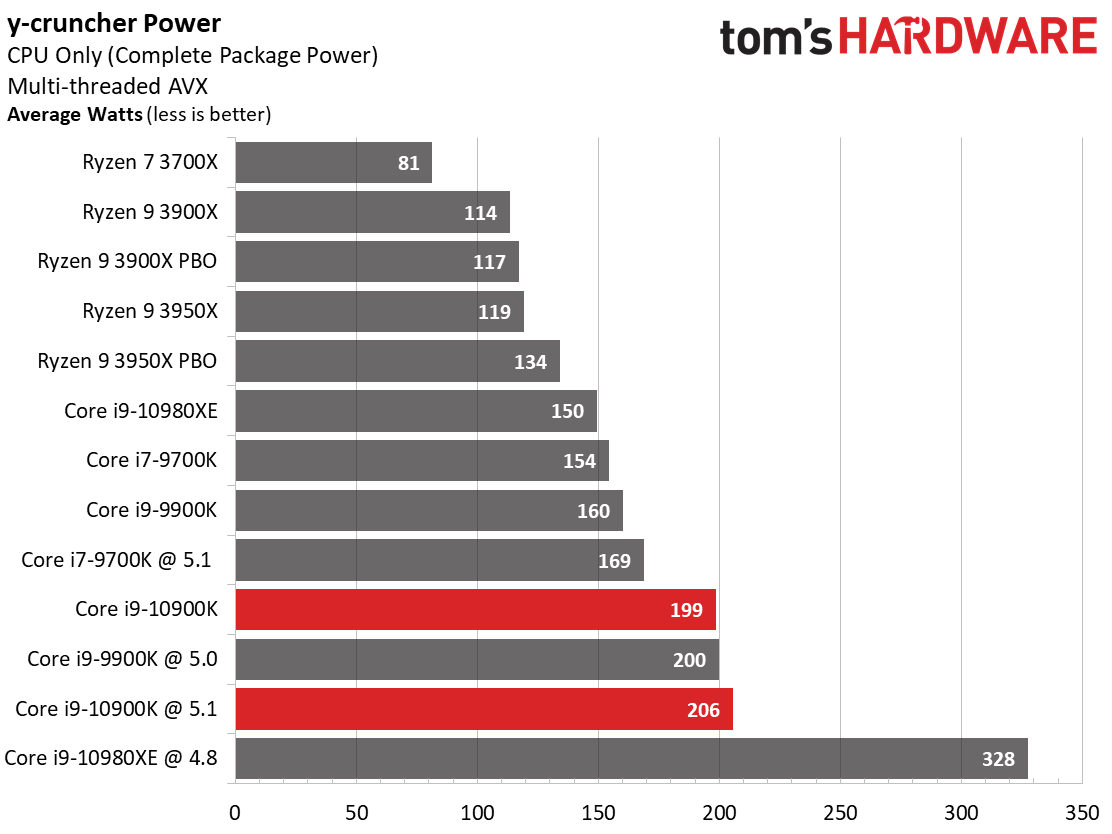
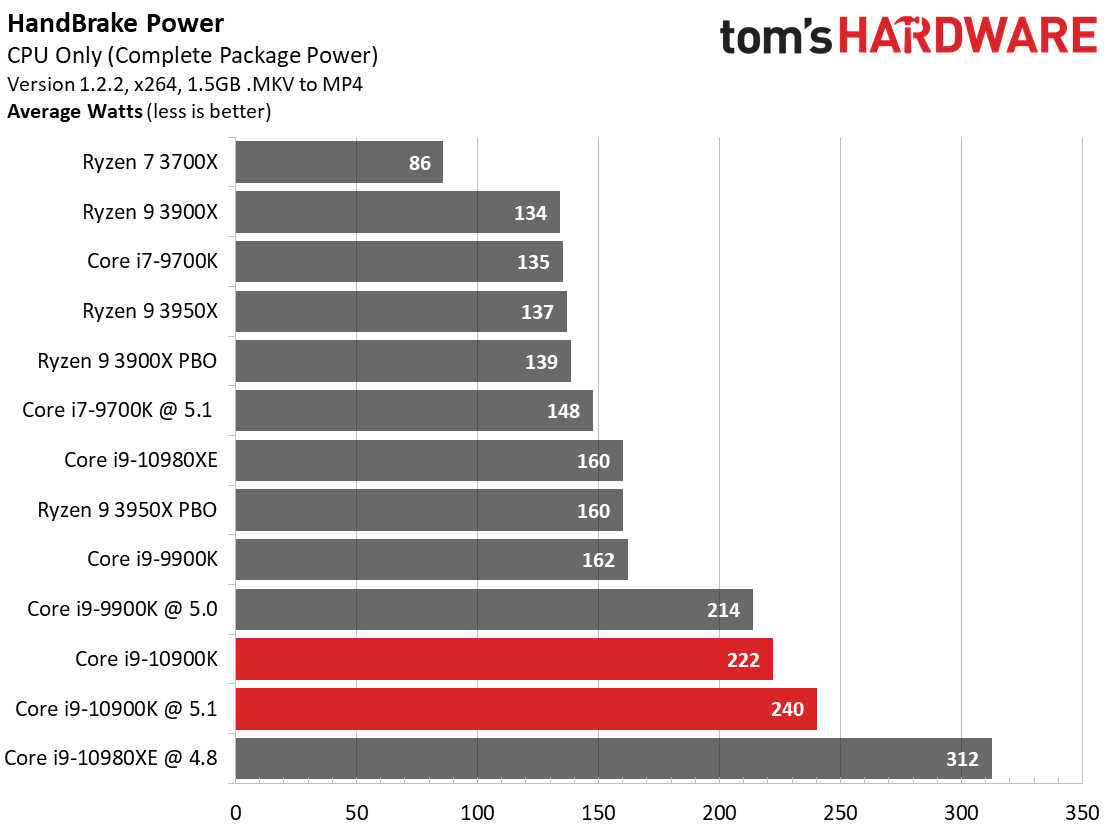
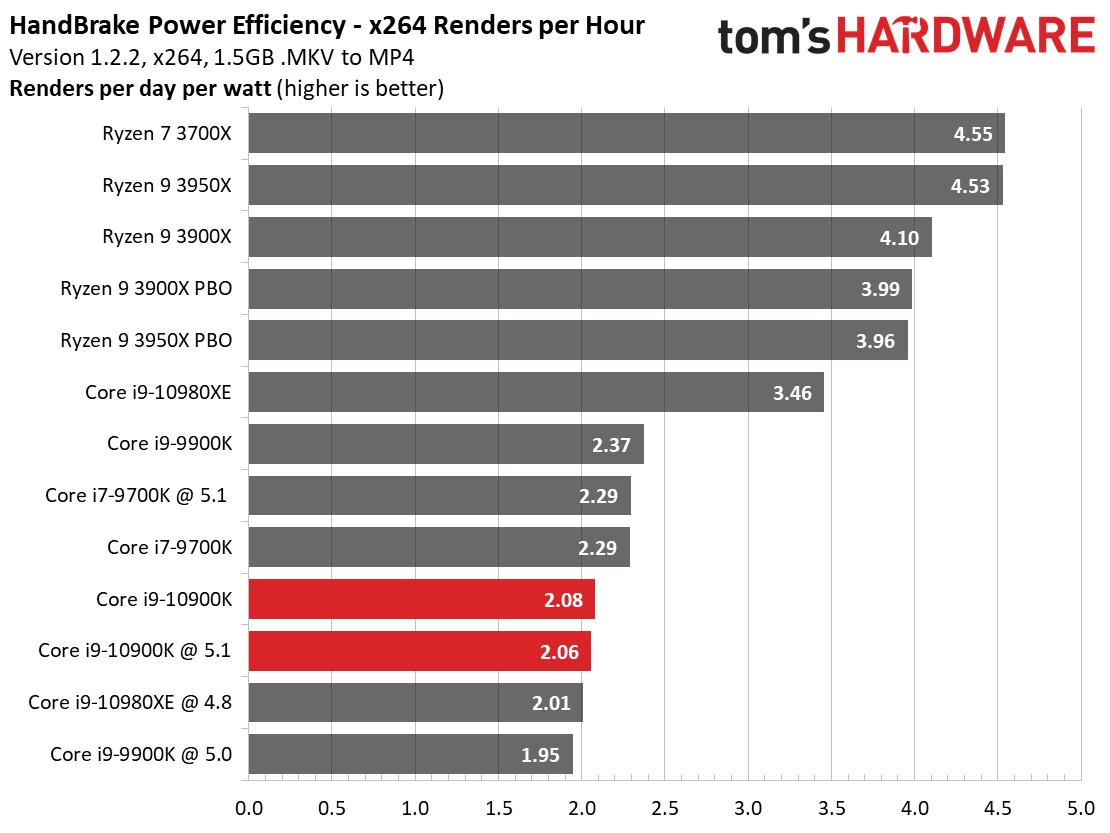
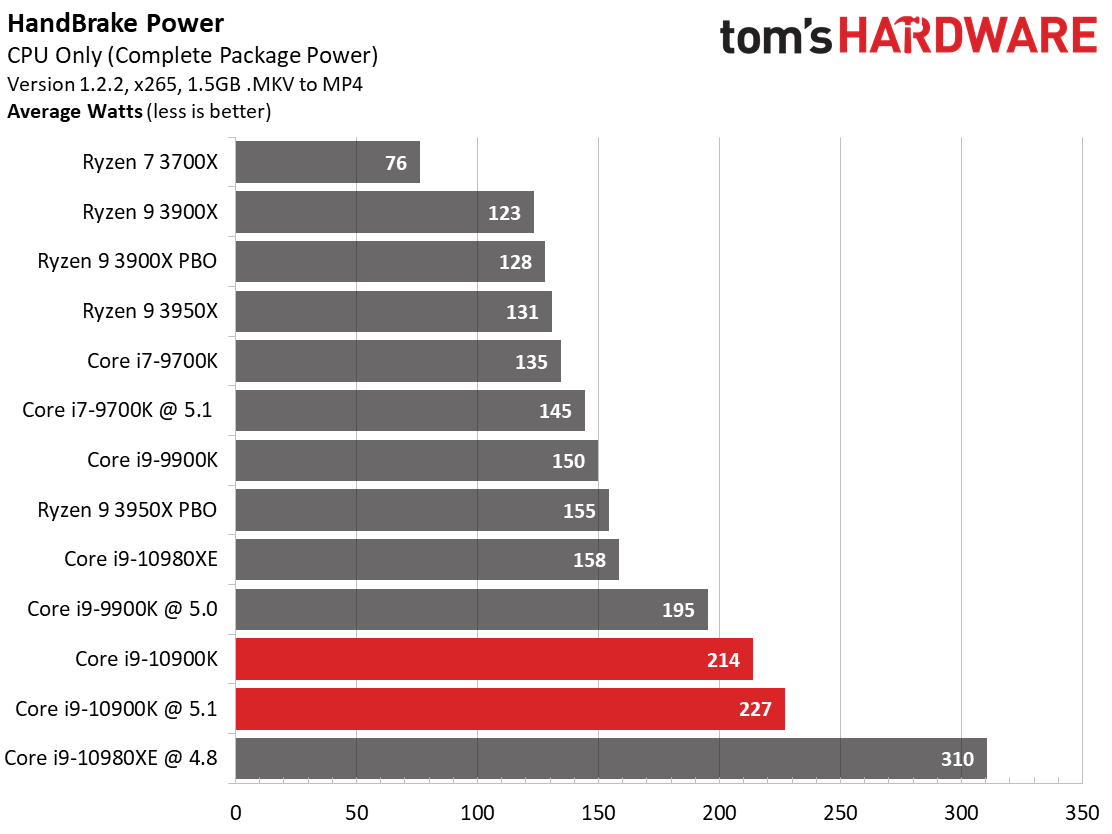
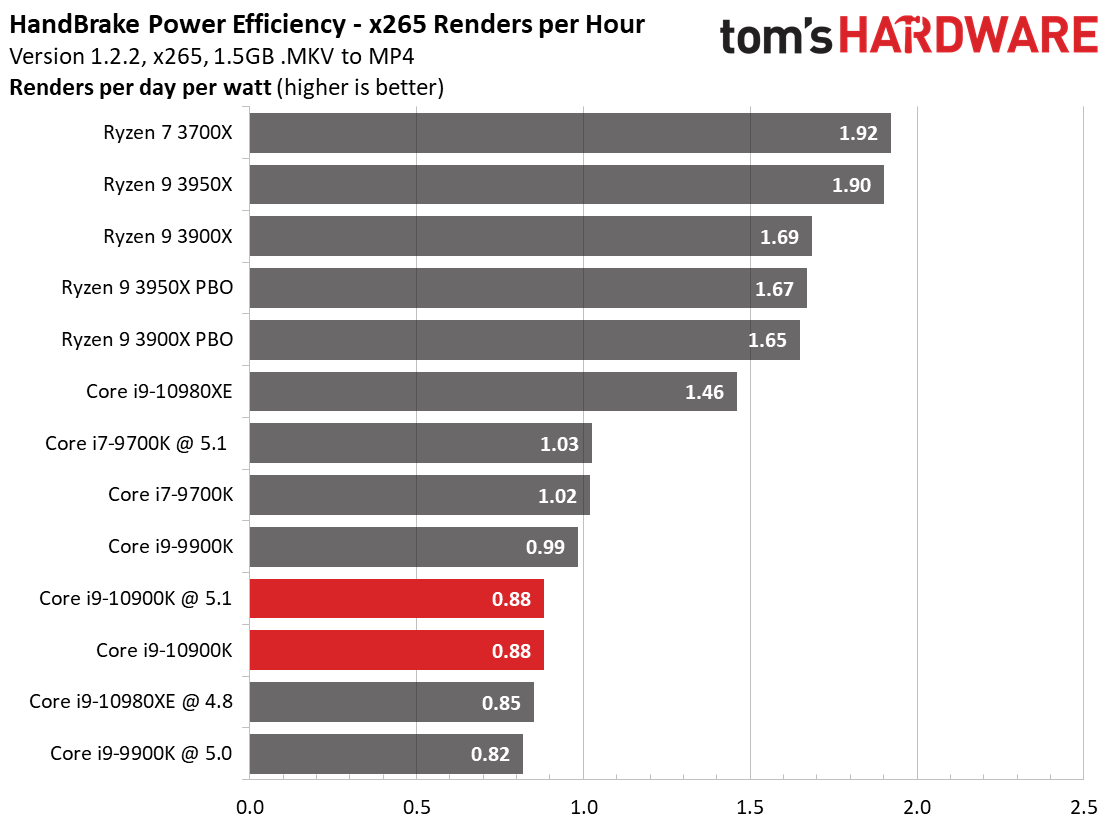
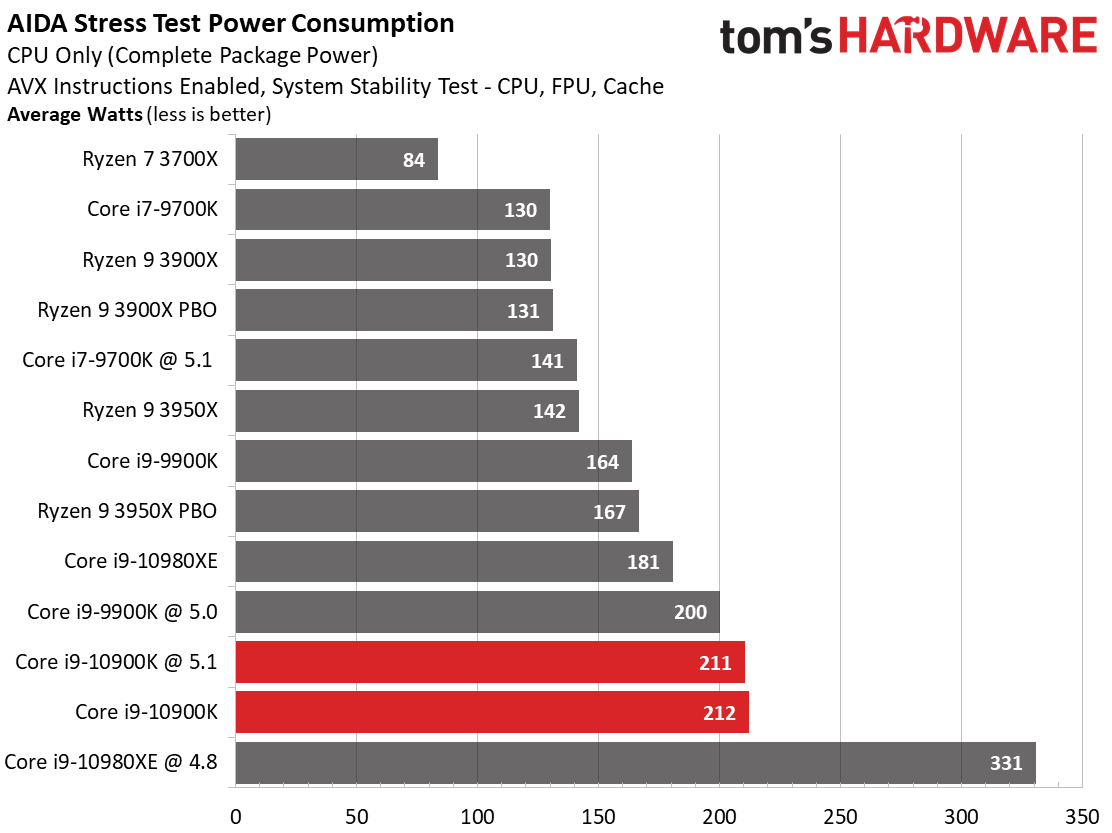
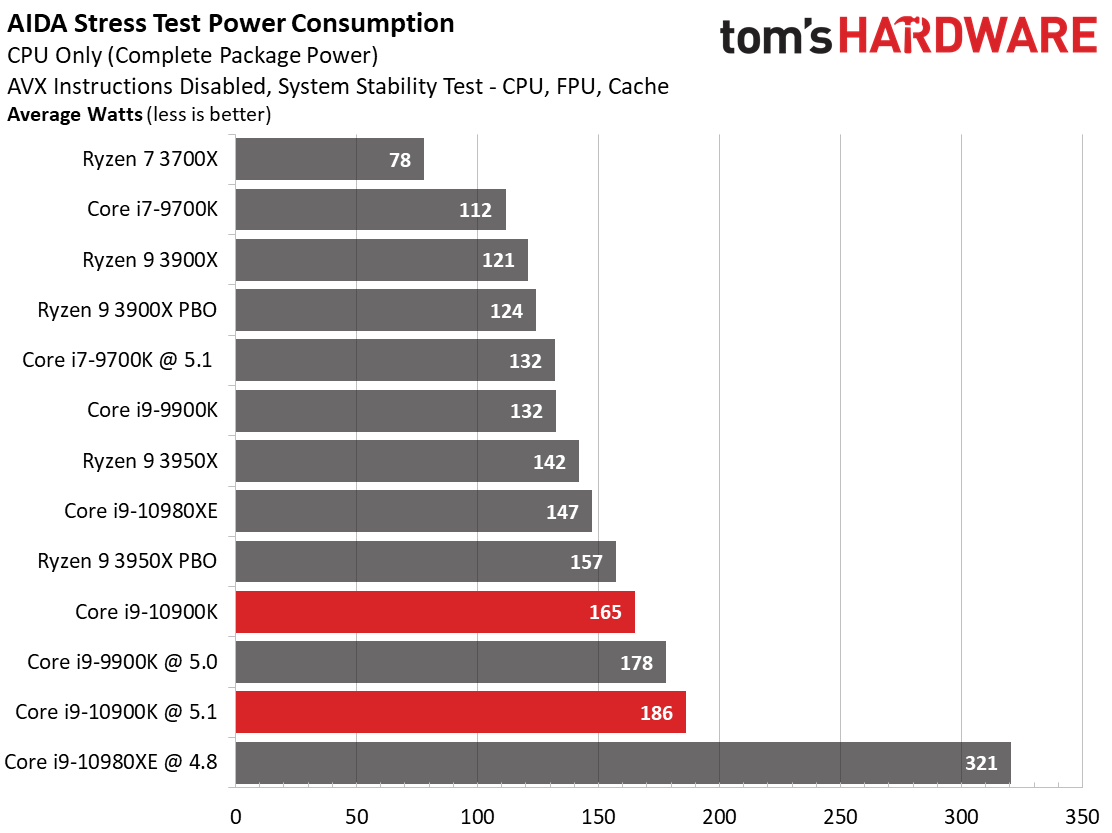
In a surprise to absolutely no one, the Core i9-10900K notched high power consumption measurements and poor efficiency metrics.
As we can see, the stock 10900K draws nearly the same amount of power as the overclocked 9900K during the multi-threaded y-cruncher test, and exceeds its predecessor during the HandBrake workloads. We actually don't see too much of an increase in power due to overclocking, largely because the Core i9-10900K is already overclocked at its stock settings.
Ryzen's stellar power consumption and efficiency, especially given their high core counts relative to competing Intel models, is impressive. That's simply the benefit of having a smaller, denser 7nm TSMC node. In terms of efficiency, it's clear that Intel's Core i9-10900K isn't nearly as efficient as any of the Ryzen 3000 series processors.
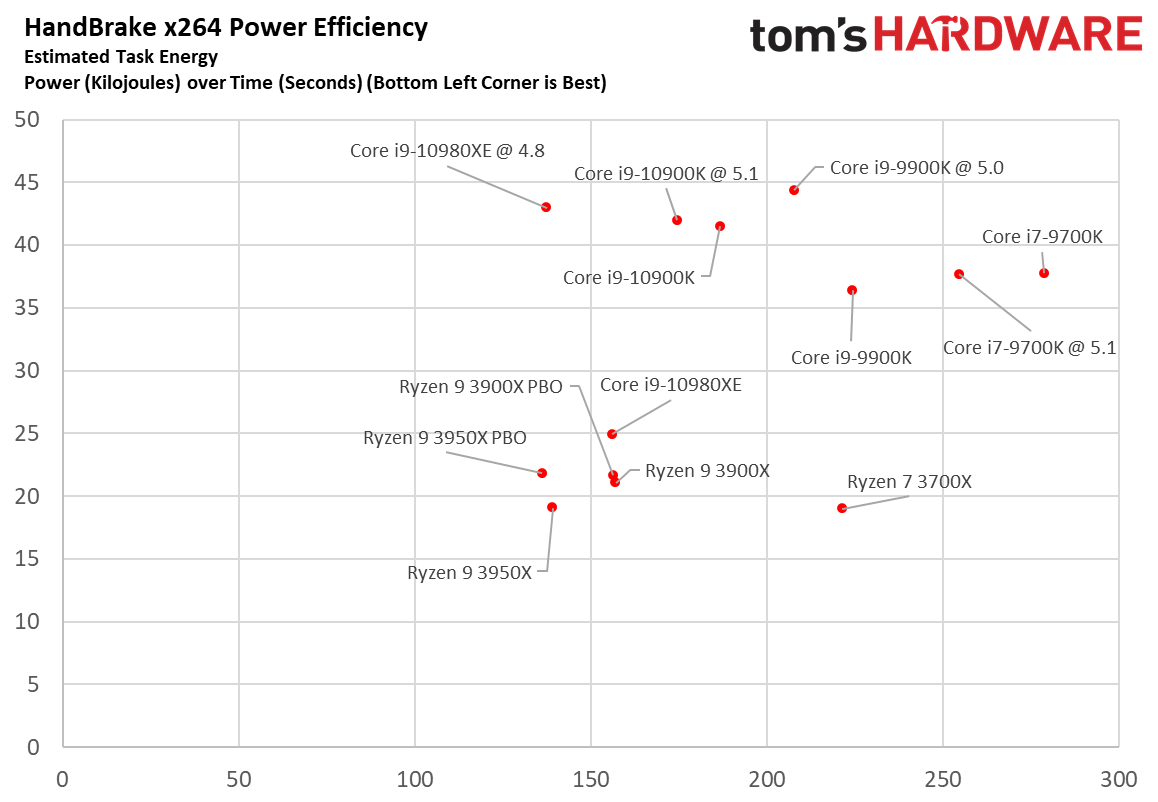
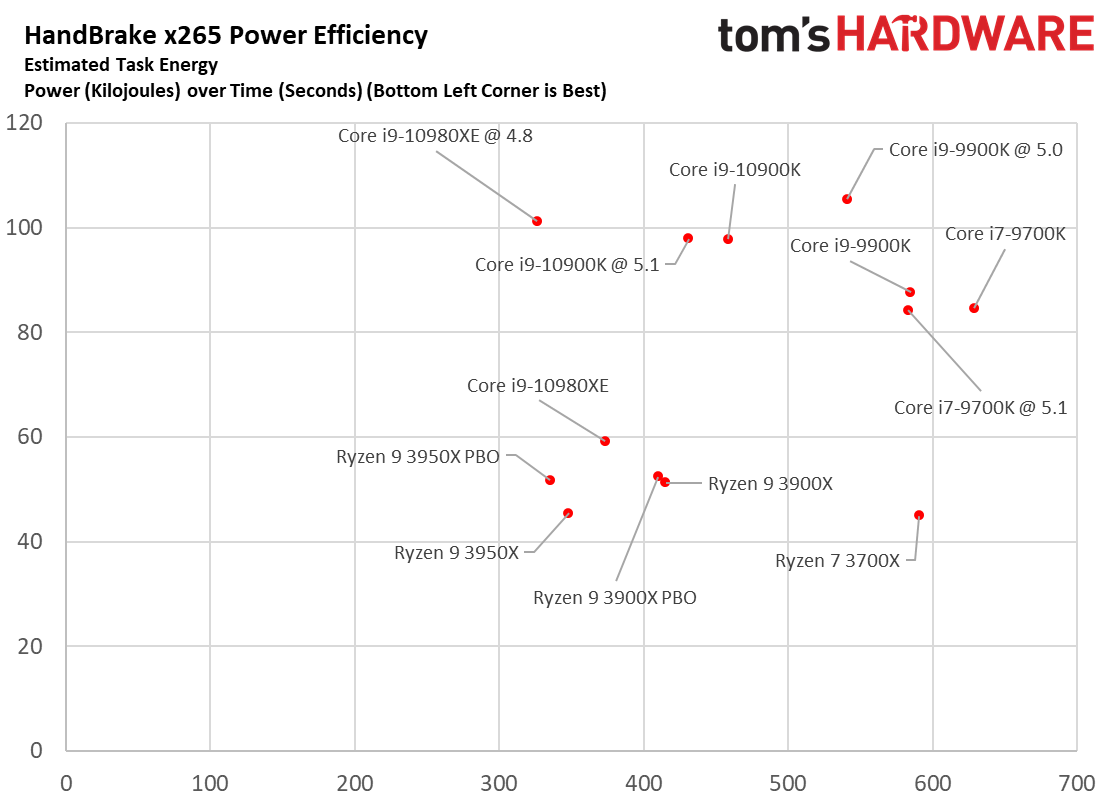
Here we take a slightly different look at power consumption by calculating the cumulative amount of energy required to perform an x264 and x265 HandBrake workload, respectively. We plot this 'task energy' value in Kilojoules on the left side of the chart.
These workloads are comprised of a fixed amount of work, so we can plot the task energy against the time required to finish the job (bottom axis), thus generating a really useful power chart.
Bear in mind that faster compute times, and lower task energy requirements, are ideal. That means processors that fall the closest to the bottom left corner of the chart are best. As we can see, Intel's bevy of 14nm chips ring the upper right (ie, undesirable) corner of the chart while the AMD processors distance themselves from all but the Core i9-10980XE.
Pay close attention to the Core i9-10980XE, though. That's what a 14nm chip dialed into the efficiency sweet spot of the voltage/frequency curve looks like in operation, while the Core i9-10900K represents the exact opposite - performance at all costs, regardless of power consumption.
Overall, the Ryzen processors are faster at this test and consume much less cumulative power to complete the tasks. That speaks to the efficiency of the 7nm process, and one can only imagine how much more efficient the chips would be if the central 12nm I/O die were fabbed on the 7nm process, too.
MORE: Best CPUs
MORE: Intel and AMD Processor Hierarchy Comparisons
MORE: All CPUs Content
Current page: Intel Core i9-10900K Power Consumption, Turbo Boost, Thermals
Prev Page Core Wars Meet High Power Draw Next Page Overclocking, Architecture, and Test Setup
Paul Alcorn is the Managing Editor: News and Emerging Tech for Tom's Hardware US. He also writes news and reviews on CPUs, storage, and enterprise hardware.
-
st379 7 fps more on average than 9th gen.... very impressive:cautious:.Reply
At least we have rdna 2, ampere and ryzen 4000 later this year. There will be some very exciting products later this year. -
dave.jeffers Even if you want the 10900k, they are saying its a paper launch. Will be interesting to see how long it takes for NE and Amazon to get stock.Reply -
tummybunny This talks about fully-patched systems. Is this considered to be a fully patched system or can we expect a host of patches for SPECTRE etc. to slow everything down when they are eventually released.Reply
I expected more discussion of what Intel might have done to reduce the endless list of security threats that have been uncovered in the last few years. -
King_V ReplyMandark said:Wait for it. The intel shills are coming to this thread soon to wail us their one lone song
Well, I mean, it does, after all, offer the biggest lead in terms of frames/second than the top AMD processor. With a 2080Ti. Um... at 1080p. At frame rates where the human eye is incapable of perceiving the difference.
But, think of it this way, at lower resolutions (1600x900, 1280x720), the frame rate lead would be EVEN MOAR!! -
Isokolon so they're releasing a CPU that for a home user is basically useless and is still worse as a workstation than a 3900X?Reply
Intel really needs to up their game. -
jeremyj_83 "The heavily-threaded y-cruncher benchmark, which computes pi using the taxing AVX instruction set, reveals what we consider to be erroneous test results based upon our previous experience with Intel chips based on the never-ending Skylake architecture."Reply
In Anandtech's review we see the same behavior for the 10900k. https://www.anandtech.com/show/15785/the-intel-comet-lake-review-skylake-we-go-again/6 Ian's said "y-Cruncher is another one where the Core i9 performs worse than the Core i7 in the multithreaded test, despite being better on the single threaded test. We again put this down to memory bandwidth. We need to update this test to the latest version of y-Cruncher, which has additional optimizations for Zen 2 processors, but also to increase the digit count in our MT test. " -
dimar 9900K will serve me well for few more years. Will be looking for upgrades once DDR5 and PCIe 5.0 hit the market.Reply
Hoping for some crazy stuff from AMD and Intel. -
InvalidError Not exactly surprised that the 10900k isn't a value king. I am far more interested in the updated bang-per-buck on the 10600k and 10700k.Reply