Platform Storage Face-Off: AMD Upsets Intel
Back in the early days of SSDs, Intel’s platforms provided consumers the fastest storage performance they could ask for. Hence, storage reviewers used mainstream Z-series platforms and i7 CPUs to extract the highest performance possible from the latest storage devices. We even initially began this article to demonstrate why this old trend continues.
However, recently, AMD’s platforms are really pulling ahead. If we consider the impact of the latest Spectre and Meltdown security mitigations, which punish storage performance under numerous circumstances and shaves off a lot of Intel's advantage, it seems the tables have turned in AMD's favor.
In contrast to our initial suspicions and historical data, storage performance on AMD platforms is actually now very comparable to Intel. As a matter of fact, the latest security patches seem to have turned raw storage benchmarks in favor of the red team. And we did our testing on the AMD side on X470. With the new X570 chipset and Ryzen 3000 CPUs about to arrive, flush with bandwidth-doubling PCIe 4.0 support, AMD's position on the storage front is likely to improve--at least after the platform irons out any early issues revolving around BIOS updates and drivers.
But, does that actually translate into real-world gains? Not so much, actually. When we add real-world workloads and applications into the mix, Intel usually comes out on top -- but not always. Let's dig into the testing to find out exactly what's going on.
Hardware Configuration
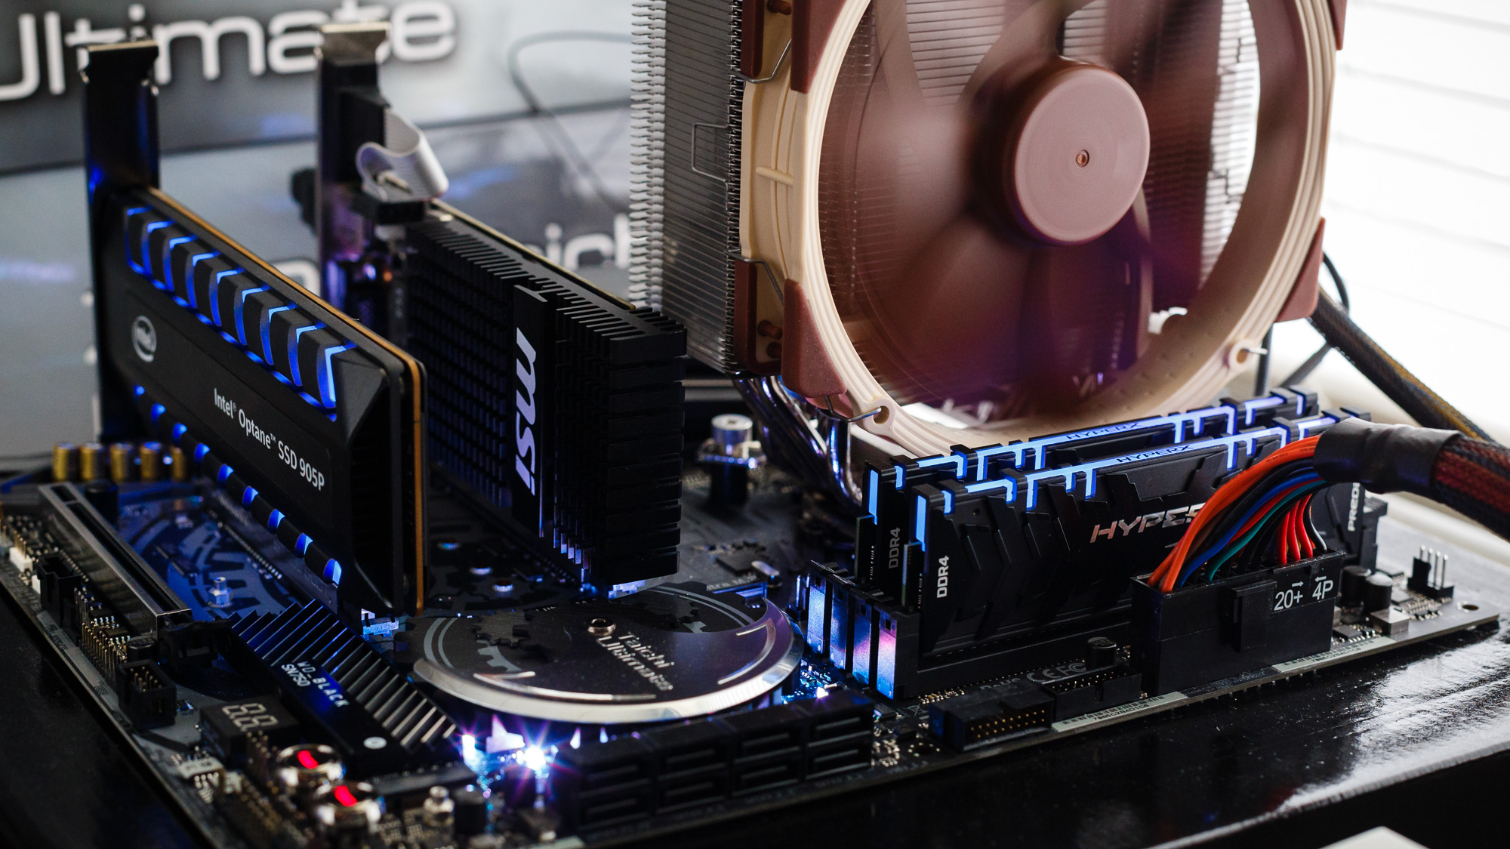
We used similarly-equipped ASRock motherboards to reduce the number of variables in our testing. We’ve chosen two ASRock Taichi Ultimate motherboards. Both of these boards are a storage lover’s dream. They come decked out with eight SATA ports, multiple M.2 slots, 10GbE networking, and, of course, they feature their respective Z390 and X470 chipsets.
There is one important thing to note here, though. While the Z390 motherboard’s M.2 slots all operate at PCIe full 3.0 x4 bandwidth, not all will operate at that speed on the X470 motherboard. Instead, the last M.2 slot (furthest from the CPU) operates at PCIe 2.0 x4 speeds on most X470 motherboards, cutting bandwidth in half. This slot isn’t the best choice if you’re looking for the best performance, but our benchmarks prove that giant cut in potential performance doesn’t always relate to much performance loss in real-world applications.
We decided to compare similarly-priced chips, but there are some tradeoffs. For the blue team, we have a Core i7-9700K. At $405, it is a bit pricey for an eight-core CPU without Hyper-Threading, but with a turbo frequency that stretches up to 4.9 GHz, it's quite the speedy slice of silicon. AMD has been at the forefront of offering more for less, so it should come as no surprise that we chose the $280 eight-core, 16-thread Ryzen 7 2700X. It features double the usable threads, but boost clock frequencies are lower than Intel’s, topping out at just 4.3 GHz.
Get Tom's Hardware's best news and in-depth reviews, straight to your inbox.
As per our standard testing procedure, we outfitted both systems with the same Noctua NH-U14S cooler, MSI GT720 GPU, and Kingston HyperX Predator RGB 2x8GB 4000MHz CL19 memory kit running at 3,000 MHz.
Software Configuration
We updated both motherboards to the latest UEFI version to patch up the latest rounds of vulnerabilities, bringing our systems up to UEFI 4.0 on the Z390 motherboard and UEFI 2.0 on the X470 motherboard. We also left both CPUs at stock clocks and disabled all the power saving features in the UEFI. This means no Speed Step, Speed Shift, Active State Power Management (ASPM), C-States, or P-States. We also disabled some optional controller chips, such as the LAN chips on both boards, and Thunderbolt 3 on the Z390 board.
We used 64-bit Windows 10 Pro. Like the UEFI, we updated to the latest version of Windows, v1809 – OS Build 17763.504, with all the latest security patches, including Meltdown, Spectre, and MDS mitigations. We also disabled Windows update, system restore, Windows Defender Antivirus, and the page file to reduce variances due to background processes.
We also installed the latest chipset drivers and Nvidia graphics driver. The X470 system froze repetitively on boot with the standard Nvidia driver delivered via Windows update (v388), so we had to manually install the latest revision (v430) to solve the issue.
Comparison Products
We opted to use some of the most consistent SSDs available to test each type of Windows-bootable storage interface. To test the SATA interface, we used a 1TB Samsung 860 EVO. For the PCIe M.2 slots we used a 1TB Samsung 970 EVO Plus, and we used the 1.5TB Intel Optane SSD 905P to test the PCIe slot.
Game Scene Loading – Final Fantasy XIV
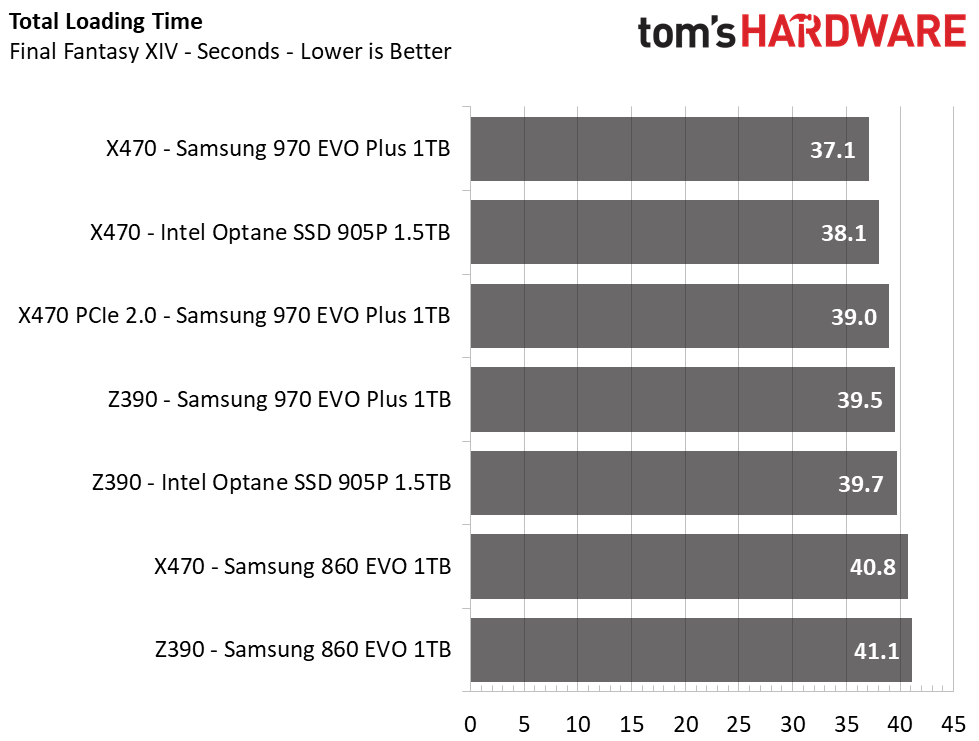
The Final Fantasy XIV StormBlood benchmark is a free real-world game benchmark that easily and accurately compares game load times without the inaccuracy of a stopwatch.
AMD squashes Intel with a 1-2 second lead across the board. Surprisingly, Samsung’s 970 EVO Plus even outperformed the Intel 905P on the X470 chipset. Though the difference in load times between these two platforms is pretty minuscule, you may want to look to AMD if you want the absolute fastest game load times.
Winner: AMD
System Boot Time
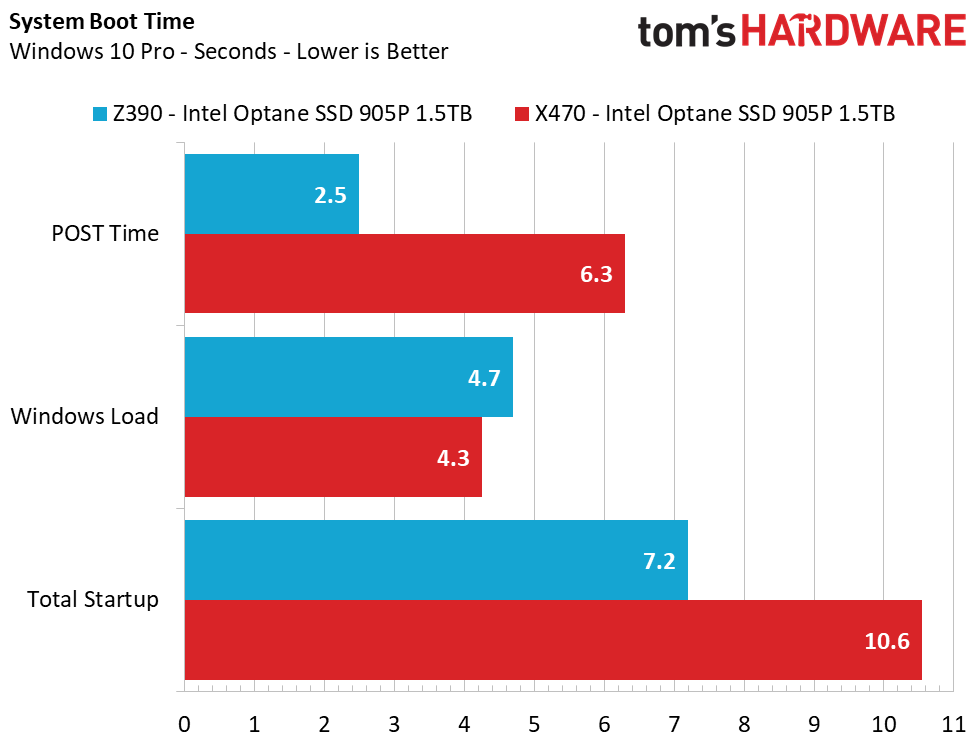
System boot was once a long and daunting task, but with the introduction of flash media, boot times now fly by. Here, we rebooted our system multiple times to find the average boot time. We did so with Windows 10’s fast boot feature enabled, Ultra-fast boot enabled in the UEFI, and a one-second POST delay enabled.
Boot times are among our most interesting results. As we'll show below, Intel’s platform displays higher application performance than AMD, but AMD's superior access performance seems to help during the boot process. The actual Windows load time was half a second faster on the AMD platform, but the Z390 system POSTed nearly four seconds faster, allowing it to triumph in total boot time. This tells us that AMD still needs to optimize the X470 platform's POST times.
Winner: Intel
Transfer Rates – DiskBench
We use the DiskBench storage benchmarking tool to test file transfer performance with our own custom 50GB block of data. Our data set includes 31,227 files of various types, like pictures, PDFs, and videos. We copy the files to a new folder and then follow up with a read test of a newly-written 6 GB file.
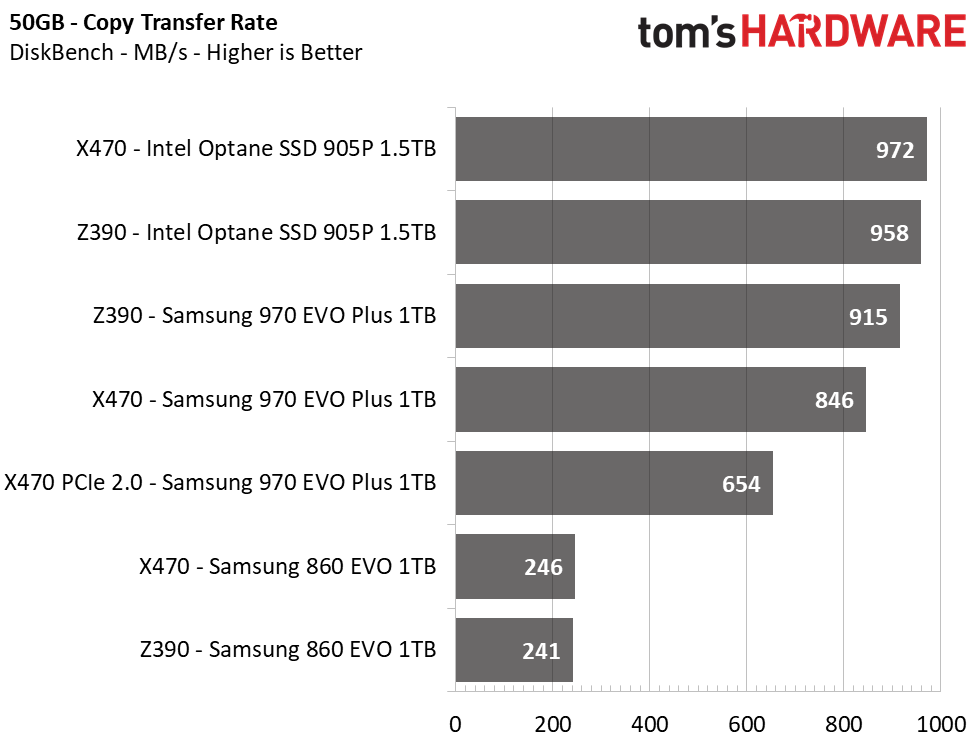
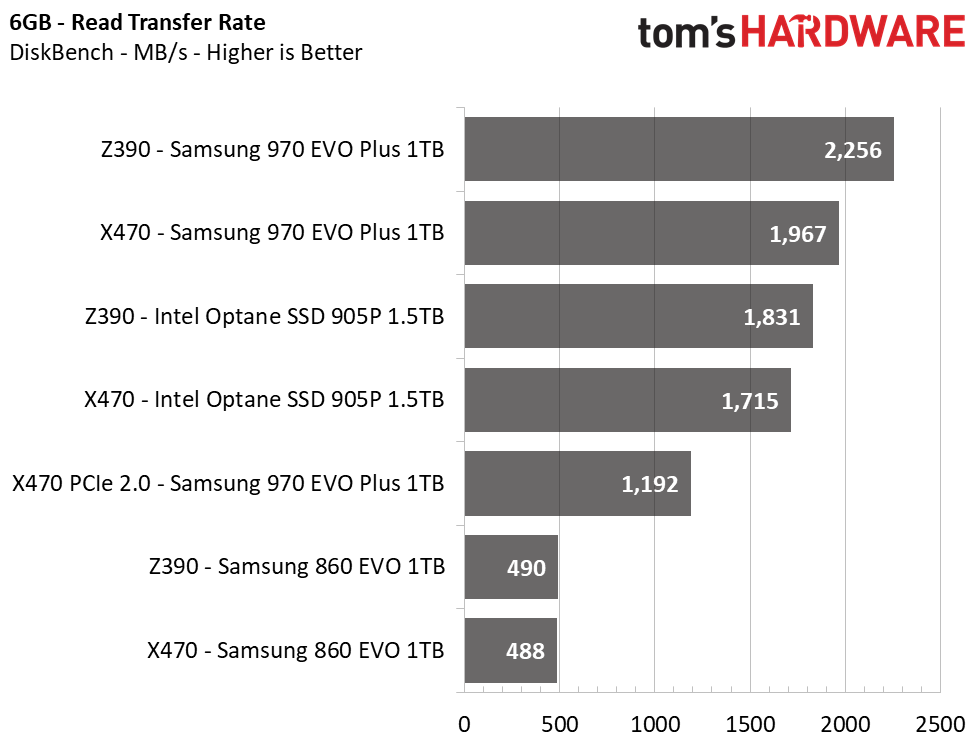
File transfer speeds are more reflective of real-world performance than our synthetic testing below. Intel’s system came out on top more often than not when we moved actual files around. The Optane 905P copied our 50GB test folder to and from itself faster on the AMD system than it did on the Intel system, but it was the opposite for the 970 EVO and 860 EVO. All drives tested on the Intel platform also read the files faster.
Winner: Intel
Trace Testing – PCMark 8 Storage Test 2.0
PCMark 8 is a trace-based benchmark that uses Microsoft Office, Adobe Creative Suite, World of Warcraft, and Battlefield 3 to measure the performance of storage devices in real-world scenarios.
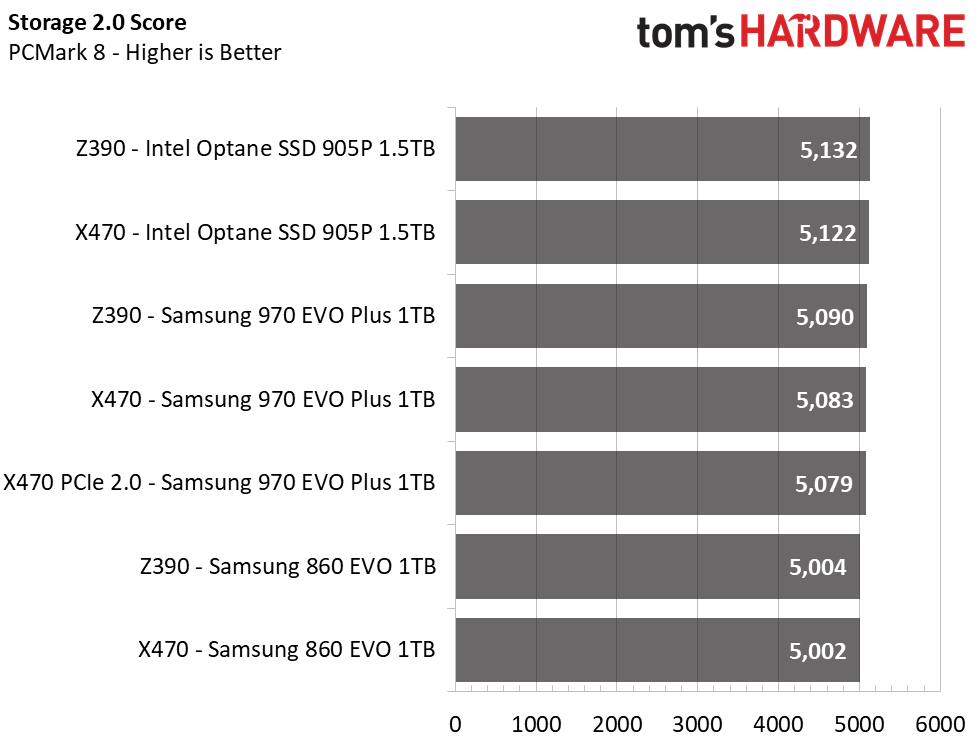
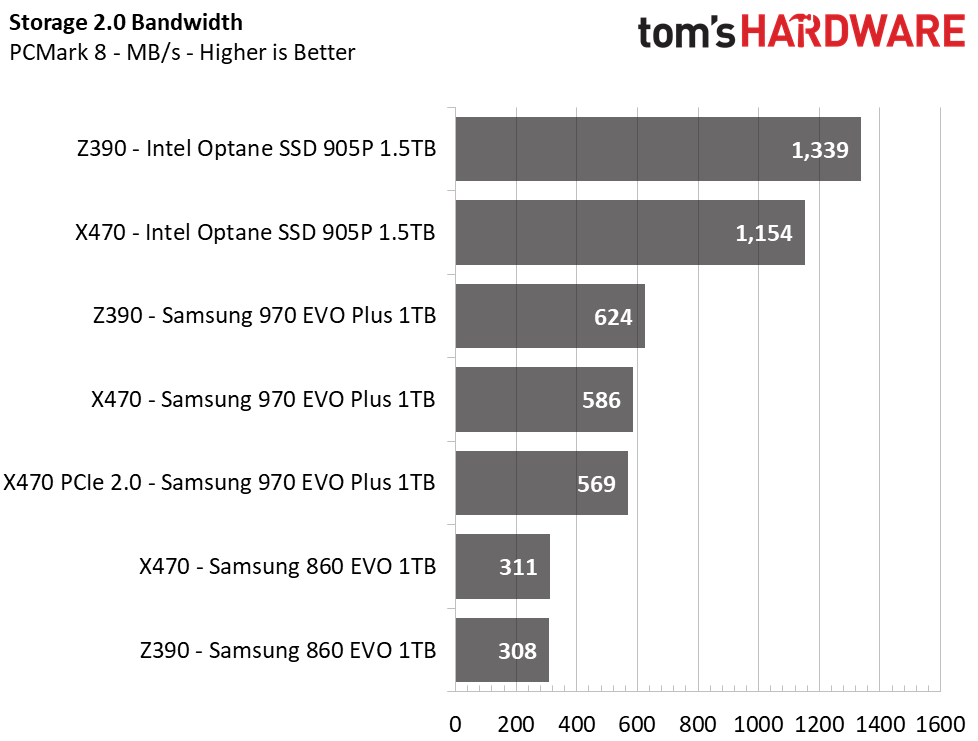
As we saw in our DiskBench testing, while our Intel system falls behind AMD in the synthetic testing below, working with real data is entirely different. In PCMark 8, the Samsung 970 EVO Plus’ performance improved 7% when operating on the Intel platform, and the Intel 905P improved by 16%. SATA results revealed very little difference between the two in real-world tests, and so did going from a PCIe 3.0 x4 link to a PCIe 2.0 x4 link.
Winner: Intel
Application Testing – SYSmark 2018
Like PCMark, SYSmark uses real applications to measure system performance. SYSmark takes things much further, however. It utilizes fourteen different applications to run real workloads with real data sets to measure how overall system performance impacts the user experience. BAPCo's SYSmark 2014 SE installs a full suite of applications for its tests, which includes Microsoft Office, Google Chrome, Corel WinZip, several Adobe software applications, and GIMP. That also makes it a great test to measure the amount of time it takes to install widely-used programs after you install a fresh operating system.
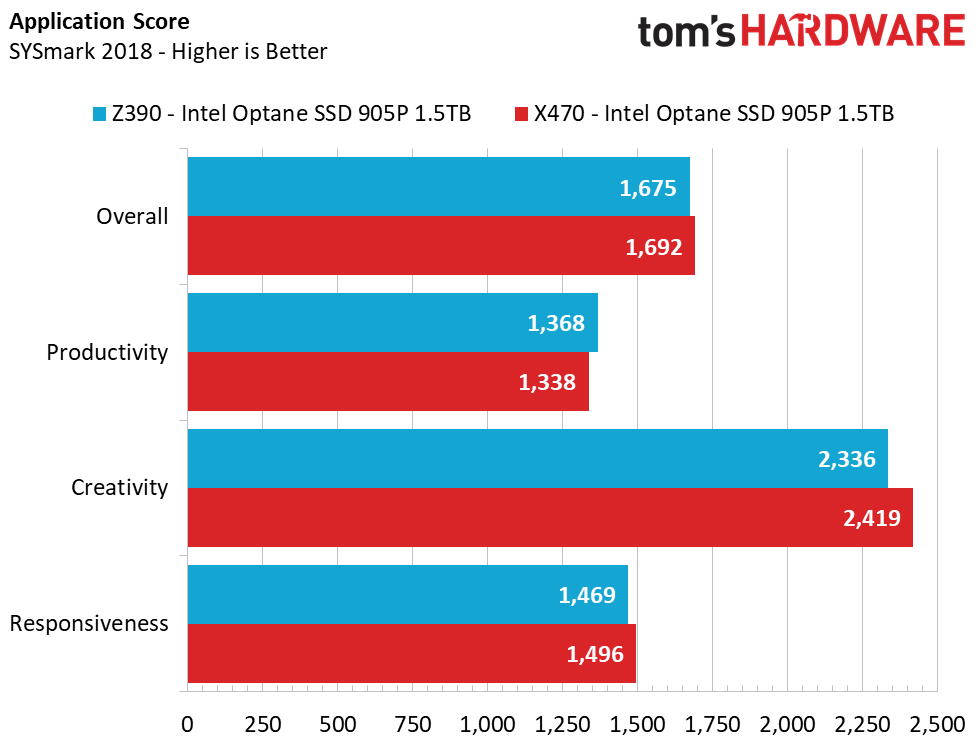
While AMD has a clear advantage in creativity tasks where applications favor more cores and threads-our Intel system outperforms it in the productivity test even though it has fewer threads. It seems Intel’s architecture and/or higher clock rates help boost office application performance over our AMD system. But the AMD system was faster in productivity and task responsiveness, and it nailed the highest overall score. Even though the AMD system wins here, let’s not forget that both systems perform within 1-4% of one another, so differences are slight.
Winner: AMD
Synthetics – CrystalDiskMark
CrystalDiskMark (CDM) is a simple and easy to use file size benchmarking tool.
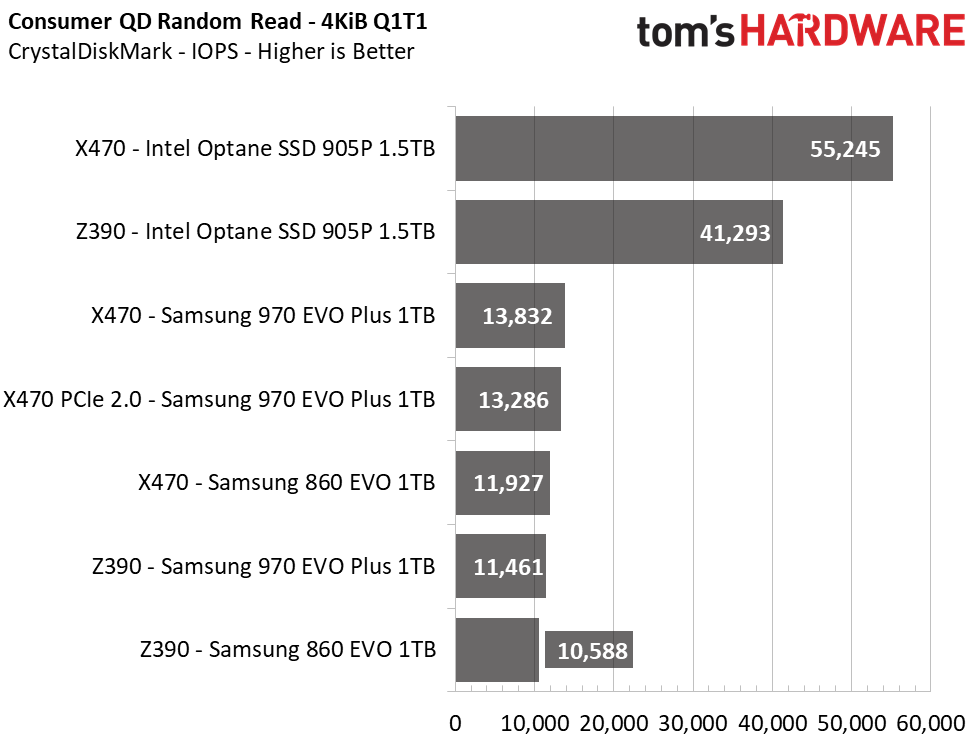
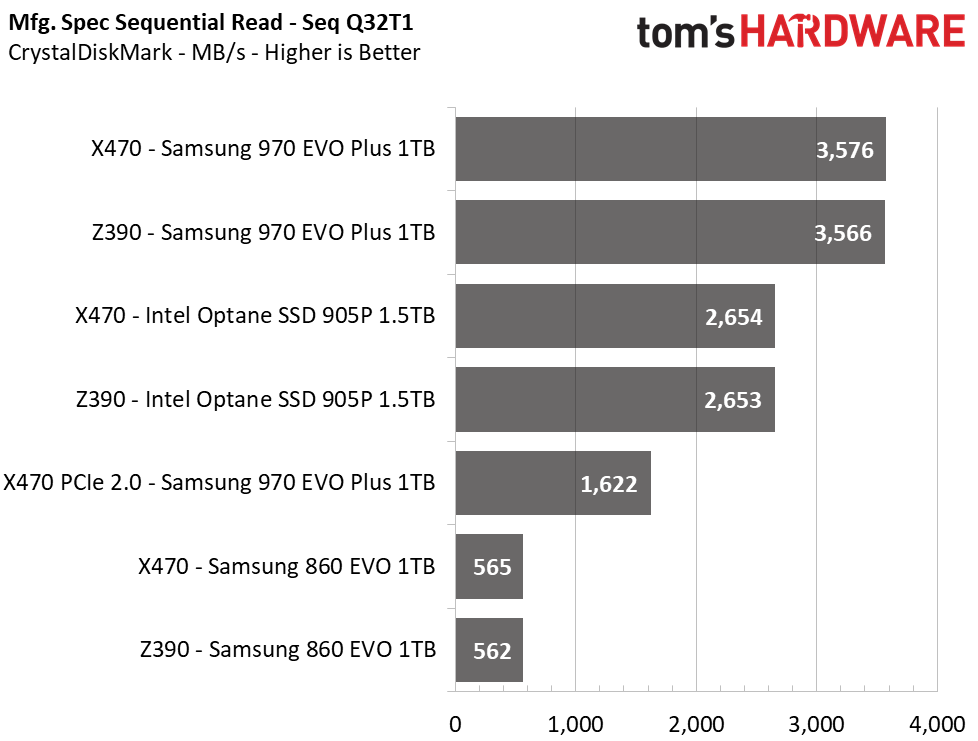
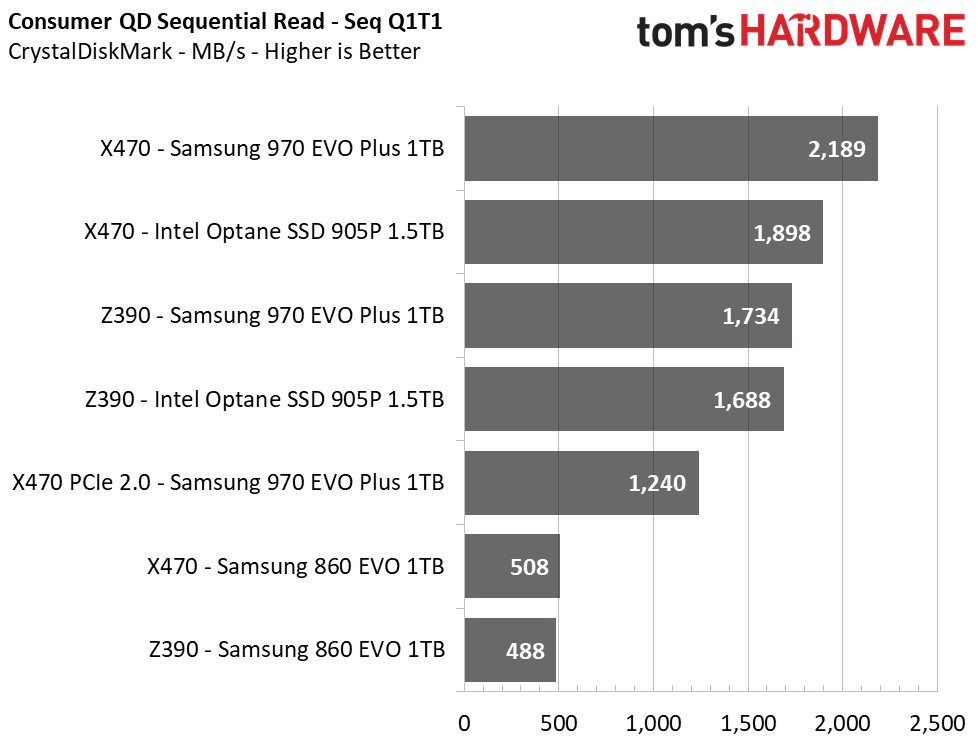
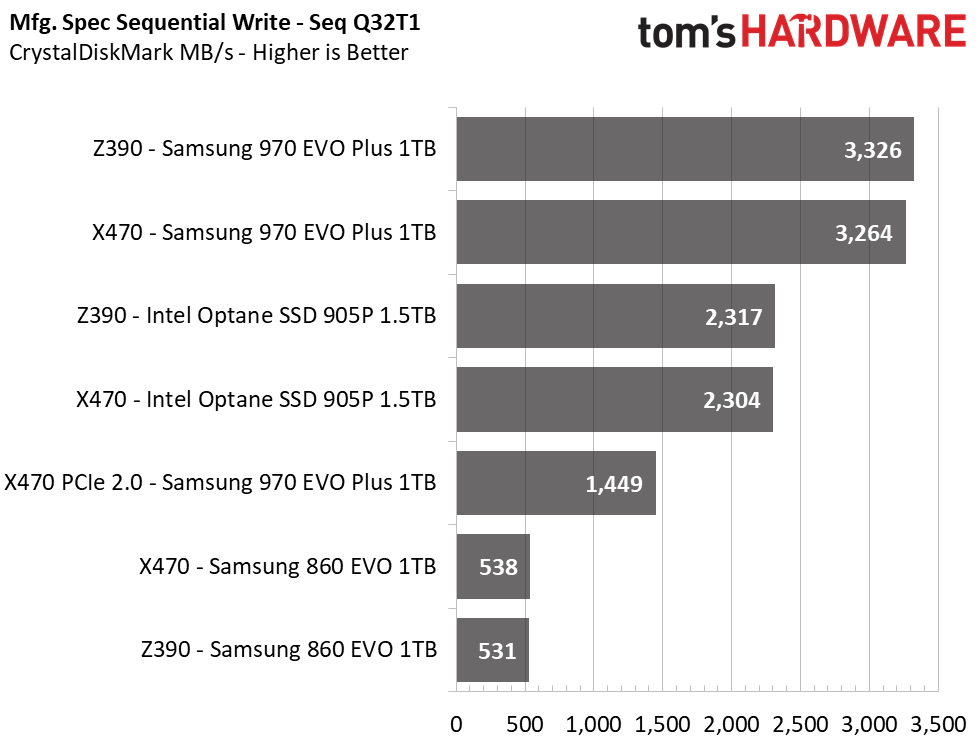
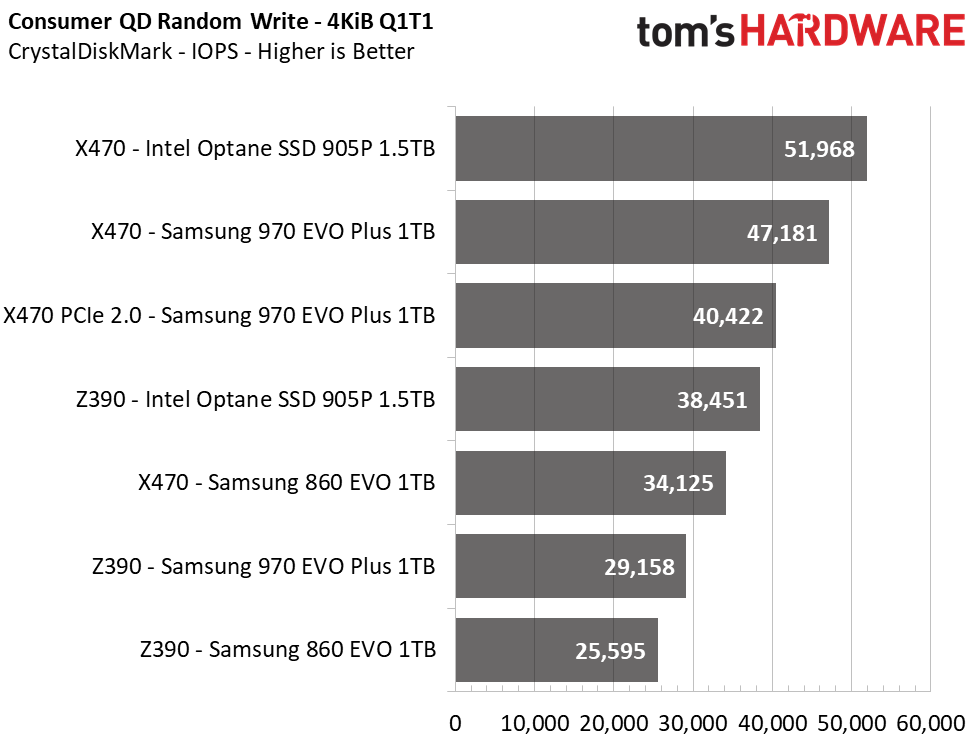
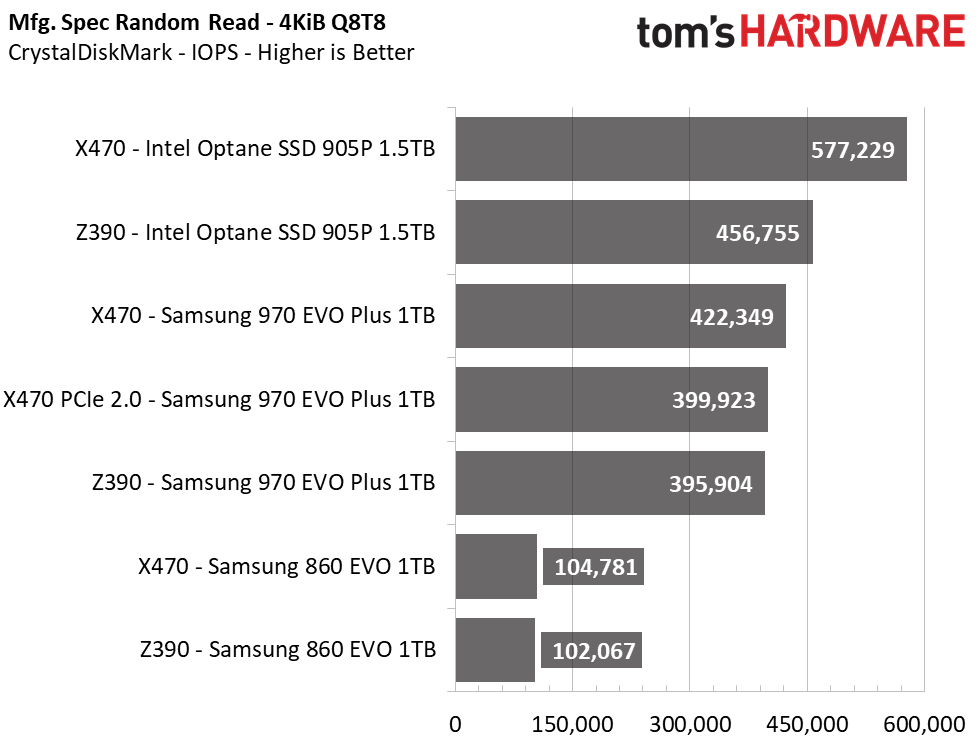
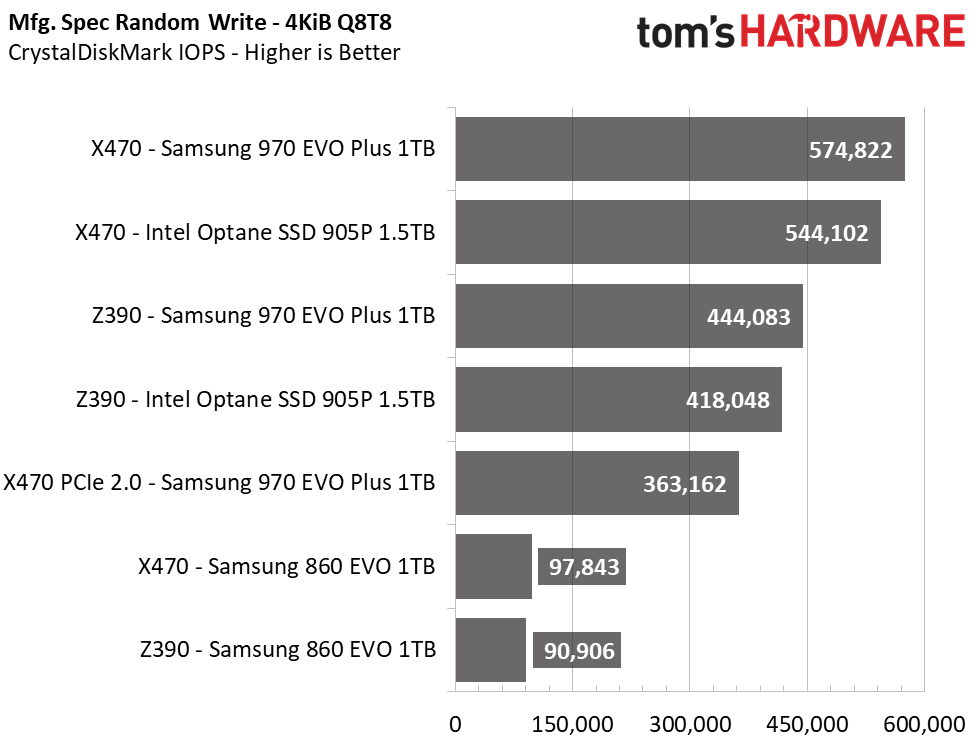
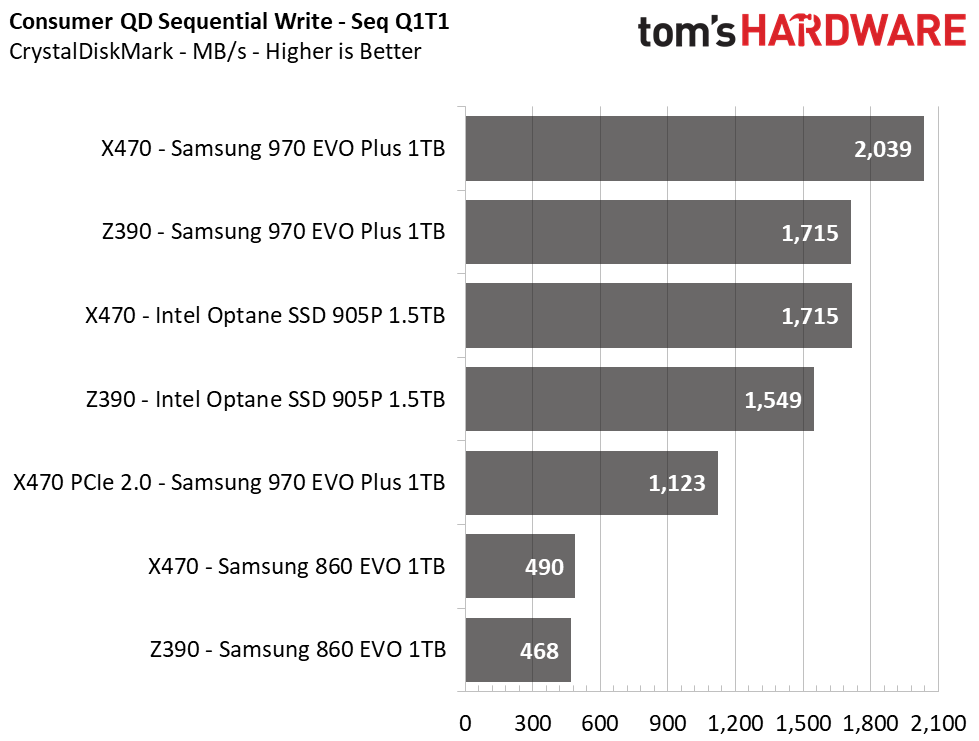
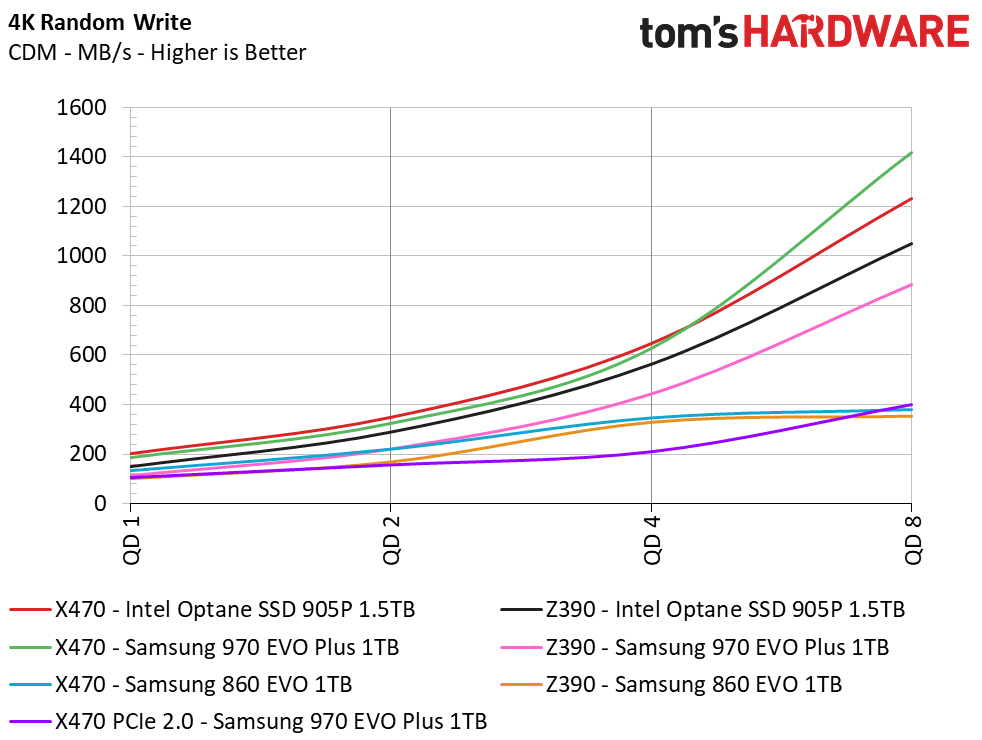
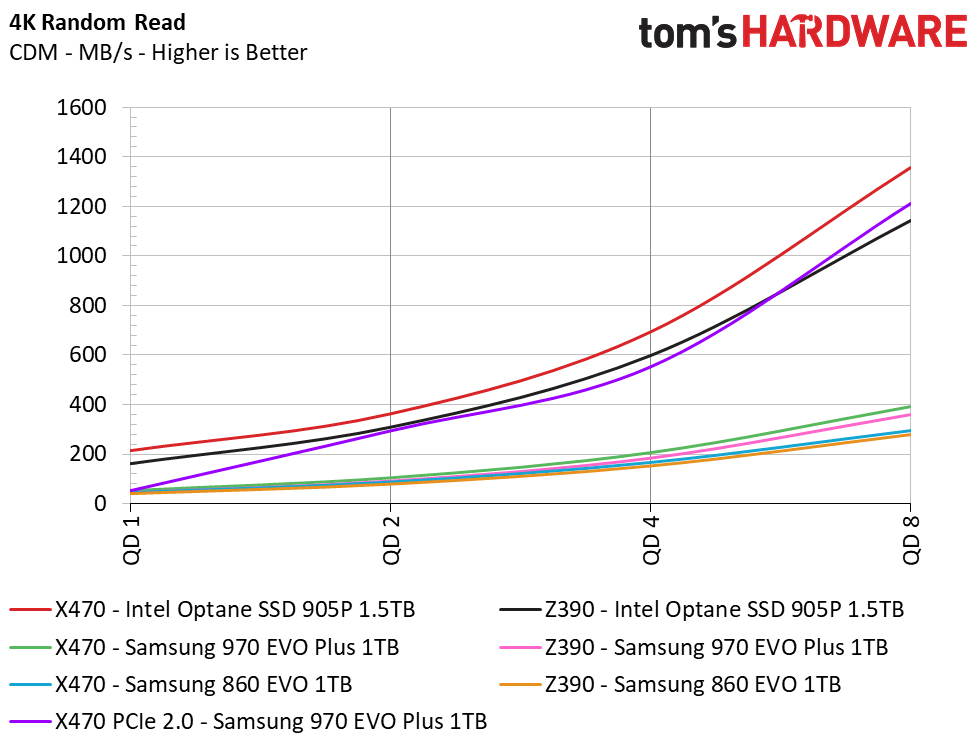
This benchmark allows us to see both sequential and random performance at various queue depths, so it is quite helpful to illustrate the difference between the two platforms.
Overall synthetic performance falls in favor of our X470 system. With a 200-300 MB/s lead over our Intel system with PCIe devices, the AMD platform delivers higher sequential speeds, even at a QD of 1. On the AMD system, the Samsung 970 EVO Plus had an 18-25% advantage in sequential read/write performance, and the Intel 905P was 10-12% faster. If you happen to pop your M.2 into the PCIe 2.0 x4 M.2 slot on your X470 motherboard, you’ll get about 1.6/1.5 GB/s of read/write performance, at best.
AMD's SATA performance is also 7% better at QD1. When we intensified the load to a queue depth (QD) of 32, however, the Intel system was comparable and all devices hit their rated specs, but we caution that this isn't a realistic workload.
Random performance at QD1, which is by far the most important synthetic measurement due to its relationship to system snappiness, seems to be in AMD’s favor yet again. Intel’s 905P delivered 34% faster read performance and 35% better write performance on the X470 motherboard. The Samsung 970 EVO Plus had 20% more random read performance and an astonishing 61% improvement in random write performance at QD1. SATA performance is also better on the X470 platform. The Samsung 860 EVO was 1,000 IOPS faster during the read test and 40% faster during the QD1 write test.
We bumped up the load to QD64, using eight threads at QD8 apiece, and AMD won yet again. This time, however, it seems likely due to the extra thread count from AMD’s Simultaneous Multithreading (SMT) feature, which is similar to Hyper-Threading. The lack of Hyper-Threading on the Core i7 limits its ability to keep up with the application and actually bottlenecks our storage performance results: The -9700K’s CPU usage was maxed out while the 2700X was running with room to spare. The result is a massive 120,000 IOPS read and 126,000 IOPS write improvement with the Intel 905P on the AMD system. With all this taken into consideration, it’s quite refreshing to see AMD’s platform make Intel sweat a little on the storage side.
Winner: AMD
Conclusion
AMD has come a long way with its Ryzen architecture. Team Red now tramples on Intel during synthetic tests. Interestingly enough, however, while synthetic storage performance has shifted in AMD’s favor, and at some points it was surprising to see just how much of a lead it has, our application benchmarks show the two trade blows depending on the specific task and interface. Performance with SATA SSDs proved roughly the same overall, which was great to see.
| Row 0 - Cell 0 | AMD | Intel |
| Synthetics – CDM | ✗ | Row 1 - Cell 2 |
| Game Scene Loading | ✗ | Row 2 - Cell 2 |
| Transfer Rates – DiskBench | Row 3 - Cell 1 | ✗ |
| Trace Testing – PCMark 8 | Row 4 - Cell 1 | ✗ |
| Application Testing – SYSmark 2018 | ✗ | Row 5 - Cell 2 |
| System Boot Time | Row 6 - Cell 1 | ✗ |
| Total | 3 | 3 |
This is why we always carry out comparisons with results based upon the same system. Although the Intel i7 9700K lacks the additional eight threads that the Ryzen 7 2700X has, its architecture with faster Turbo frequencies made it come out on top in productivity, even with the latest vulnerability mitigations. And in PCMark 8, our Intel system enjoyed a 7-16% lead with PCIe SSDs, and the Intel system boots faster overall.
But, let’s not leave value out of the perspective nor forget just how small the differences were in both tests. In terms of value, our AMD system can’t be matched. While AMD's dominance in synthetics didn’t correlate to wins in all of our real-world application tests, AMD’s platform is still quite competitive. The 2700X's extra threads pushed out higher IOPS and even outperformed Intel in SYSmark 2018.
Game loading times also went in favor of the AMD platform. Surprisingly enough on that front, AMD’s platform even allowed the 1TB Samsung 970 EVO Plus to outperform the $2,200 1.5TB Intel Optane SSD 905P. But this doesn’t mean the AMD system is faster than the Intel system during actual gameplay.
If you're looking to make a purchase, storage performance shouldn't sway you too much in either direction. If you are looking for the best performance in office productivity tasks or normal day-to-day file transfers, Intel is usually going to be the winner, and games are still going to run faster. This comes at a significantly higher cost, however, and there is still the risk of further performance-killing mitigations.
If you're concerned about value, AMD wins hands down. Even if storage performance is your main main consideration, we just can’t justify spending $100-$200 more on an Intel chip for so little difference in storage performance over AMD’s Ryzen 7 2700X and all of its eight-core, 16-thread goodness.
We're of course also interested to see how storage shakes out on the X570 chipset with new Ryzen 3000 CPUs that are scheduled to arrive in July, along with support for bandwidth-doubling PCIe 4.0. While the widely reported extra cost of X570 may move the value needle a little, especially if Intel cuts prices on its processors, it seems likely that AMD will pull further ahead on storage this year--even if it's just thanks in large part to support for emerging PCIe 4.0 SSDs.
MORE: Best SSDs
MORE: How We Test HDDs And SSDs
MORE: All SSD Content

Sean is a Contributing Editor at Tom’s Hardware US, covering storage hardware.
-
Giroro Is it really necessary to keep calling Intel and AMD "The blue team" and "the red team"?Reply
The actual company names are shorter, easier to type, and probably more accessible to color blind readers...
Maybe I'm just exhausted with every aspect of society being cut into US vs THEM teams -
paul prochnow Replyadmin said:We put AMD and Intel systems head-to-head to find out which platform provides the top performance with storage devices.
I know I like what I got: R7 2700 and an SSD M.2----NVMe ADATASX8200PNP------------ BUT I did not know that I had a winner. As an untutored End Use, a real Mr. GIU, it is great to see someone would got to such great lengths and great detail to help the consumer--THANK YOU AGAIN TOM'S
Platform Storage Face-Off: AMD Upsets Intel : Read more -
paul prochnow Reply
Look---It is a matter of someone typing that all out . It saves one keystroke. Ask a corporate manager knows, we all need to know, what a few keystrokes more or less really matter.....I think in State Mangement alone, for instance, one less "e" in EmployEE as in employe saved a million bux in printing costs. Believe it of NOT. I could not, unfortunately THEY could PROVE it. WOW!Giroro said:Is it really necessary to keep calling Intel and AMD "The blue team" and "the red team"?
The actual company names are shorter, easier to type, and probably more accessible to color blind readers...
Maybe I'm just exhausted with every aspect of society being cut into US vs THEM teams -
USAFRet What I get out of that is that the magical NVMe drives (970 EVO) aren't much 'faster' than the typical SATA III drives, such as the 860 EVO.Reply -
supremelaw raw bandwidth of DDR4-3200 x 8 = 25,600 MB/secondReply
1x PCIe 4.0 lane @ 16 GHz / 8.125 (jumbo frame) x 16 lanes = 31,507 MB/second
(e.g. ASRock Ultra Quad M.2 x16 card in "4x4" mode, enhanced for PCIe 4.0)
31,507 / 8 ~= DDR4-3,938
Thus, at PCIe 4.0, an upgraded ASRock Ultra Quad M.2 x16 card
will have a raw bandwidth equivalent to DDR4-3,938.
The numbers above show that the PCIe 4.0 bus is roughly comparable
the DRAM bus using mid- to high-end DDR4 DRAM.
Now, do the same calculations using the 32G clock planned for PCIe 5.0:
1x PCIe 5.0 lane @ 32 GHz / 8.125 (jumbo frame) x 16 lanes = 63,015 MB/second
63,015 / 8 ~= DDR4-7,876 (i.e. easily surpassing DDR4 maxima at present)
Despite all of the bad press that Intel has been getting recently,
I really must credit them for developing Optane technologies,
which now promise to mass-market a non-volatile memory solution
that operates at speeds roughly comparable to mid-range DRAM.
Putting Optane on the DRAM bus is a very significant development,
for which AMD has no competition.
Keep your eyes open for Samsung's entry into the PCIe 4.0 competition!
You can bet they are planning such entry(s) with excellent foresight. -
TerryLaze Reply
And you are not just getting a fast disk,the more important part about optane ram is that the CPU is a part of the equation and can access data on that ram directly ,skipping a big part of windows I/O.supremelaw said:Putting Optane on the DRAM bus is a very significant development,
for which AMD has no competition. -
bit_user I disagree with giving Intel a "win" for boot time. Since the article focuses on I/O performance, I wouldn't include the POST time in the contest, although it was informative to measure and report it.Reply
Also, if you understand a bit about why the side-channel attack mitigations impact I/O performance, then it should come as no surprise that small, semi-random I/O's take the worst hit. The synthetics show this, pretty clearly. For most real-world use cases, such as app loading, loading game levels, CAD models, and OS booting, it's this random, small I/O that counts. Only the disk imaging and large file-copying remain largely unaffected.
BTW, the BIOS settings (such as scanning for disks and other devices) have a lot to do with POST time. It's often possible to tweak your BIOS and get that number down. I'd also expect to see different POST times for different brands that use the same chipset. -
Giroro Replypaul prochnow said:Look---It is a matter of someone typing that all out . It saves one keystroke.
I mean... It's a 9 keystroke difference. Which makes "the red team" 4 times the length of AMD.
It's just an odd trend. It reduces the clarity of the language, is harder to type, and nobody is out there referring to companies by color-team in real life so it makes the article flow more like those comparative "OUR PRODUCT VS BRAND X" style commercials than natural speech.
I just don't get it, man. -
bit_user Reply
I think it's mostly a journalistic/writing practice of trying to mix up the terminology to make it sound less tedious and formulaic.Giroro said:It's just an odd trend. It reduces the clarity of the language, is harder to type, and nobody is out there referring to companies by color-team in real life ...
I just don't get it, man.
Plus, if you see people talk about red vs. blue, then such articles help explain what they mean. And yes, I do sometimes see forum posters refer to the companies (or their fans) by color.
