The Secret Sauces of THG's LCD Tests
Color Rendering Tests, Continued
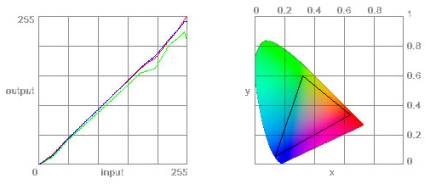
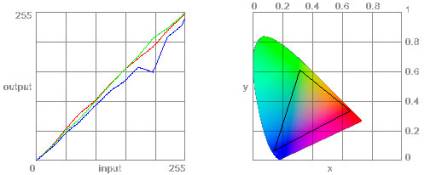
Recently, we've enriched our equipment with the addition of another calibrator, the Gretag Eye-1 Display 2. It's very similar to the LaCie Blue-eye Pro, but it also offers the gammut measurement of the screen.

The gammut graph, on the right, is an indication of the color spectrum that the device can handle. In other words, it represents the richness of the displayed colors. The corners of the triangle are the primary colors (the technology used here, of course, will never please the artists among us): pure green at the top, blue at bottom left and red at the right hand corner. So, the surface area of the triangle represents the collection of displayable colors resulting from combinations of these three primaries in different intensities according to the position of a point within the triangle and its relative distance from each of the corners. Therefore, the bigger the surface area of the triangle the richer the color.
As you'd expect, there are specifications for the different standards currently in force for a display. The sRGB (6500K, gamma 2.2) gammut, for instance, looks like this:

All PC monitors are expected to demonstrate a richness of color equal to that of this sRGB standard.
We could have used a calibrator capable of displaying the gammut of a device from any manufacturer but we preferred to use Gretag's offering so as to vary the sources of information in order to give a more complete set of results.
Stay On the Cutting Edge: Get the Tom's Hardware Newsletter
Get Tom's Hardware's best news and in-depth reviews, straight to your inbox.
Current page: Color Rendering Tests, Continued
Prev Page Color Rendering Tests Next Page Latency Measures; Introducing The Test System