Six SSD DC S3500 Drives And Intel's RST: Performance In RAID, Tested
Intel lent us six SSD DC S3500 drives with its home-brewed 6 Gb/s SATA controller inside. We match them up to the Z87/C226 chipset's six corresponding ports, a handful of software-based RAID modes, and two operating systems to test their performance.
Mixing Block Sizes And Read/Write Ratios
So far we've only tested simple workloads, including 4 KB random access and sequentially-organized data. A storage device can perform read or write operations, so a 70/30% split really just means that 70 out of every 100 I/O operations were reads, while the other 30 were writes. Most of the time, workloads aren't read- or write-only, though. Neither do they consist of just one or two block sizes. Instead, a majority of workloads are a mix of reads and writes, with block sizes between 512 bytes and 1 MB.
And just in case you missed the disclaimer on the second page, the testing we're doing right here happens under Linux (CentOS 6.4 and FIO, to be exact). If you look carefully, you'll notice that performance, overall, appears higher than the Windows-based benchmarking.
Mixing Reads, Writes, And Block Sizes
It's good to measure IOPS at different block sizes, with a mix of reads and writes. We know that serving up a ton of 4 KB blocks is more difficult than 128 KB chunks of data, typically because achieving the same throughput with smaller accesses involves a lot more overhead. The relationship between IOPS and bandwidth is pretty simple though:
| Block Size | Bandwidth at1000 IOPS |
|---|---|
| 4 KB / 4096 B | 4000 KB/s |
| 8 KB / 8192 B | 8000 KB/s |
| 16 KB / 16384 B | 16,000 KB/s |
| 32 KB / 32768 B | 32,000 KB/s |
If an imaginary SSD maxes out with 10,000 8 KB IOPS, then a 16 KB workload will probably register around 5,000. The amount of bandwidth stays the same at 80,000 KB/s, or around 80 MB/s (we'd actually have to divide the KB/s figure by 1024 to get real MB/s). With that in mind, check out the next chart:
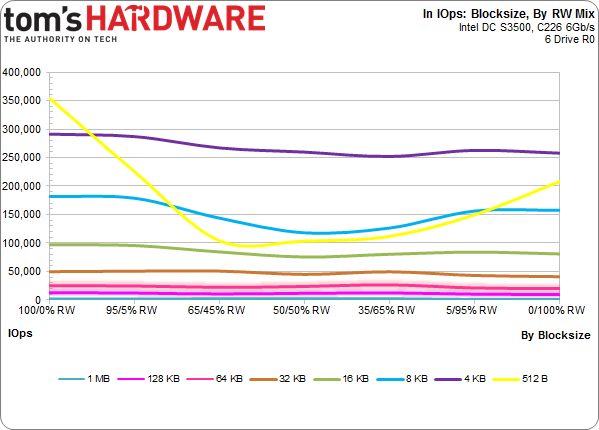
We're exposing all six SSD DC S3500s in RAID 0 to one minute of various block sizes and read/write patterns, and then showing the results in IOPS. Check out the 4 KB line in purple. It starts at 100% read and ends at 100% write, hitting five blends in between. We do that for eight block sizes at seven read/write ratios for a total of 56 data points. Each one is the average IOPS generated over one minute, so it takes less than an hour to benchmark the array this way. The paradigm is similar to our earlier testing with two threads. This time, though, each thread generates a queue depth of 32, yielding a total outstanding I/O queue of 64.
You'll notice that the yellow line, which represents 512-byte blocks, begins at 350,000 IOPS and drops significantly before gaining some ground back as the workload switches to primarily write operations. That's actually common for 512-byte I/O, which are less than optimal for flash-based solutions that prefer 4 KB aligned accesses. A 512-byte access is, by definition, misaligned. So, most SSDs and RAID arrays choke on them to a degree.
Next, the 4 KB line (in purple) begins at 300,000 IOPS, and falls gradually until we push a 5/95% mix, where it edges up ever so slightly again. Most SSDs don't write as quickly as they read, so it's natural to expect that line to slope downward.
Get Tom's Hardware's best news and in-depth reviews, straight to your inbox.
Last, we'll look at where each block size lands in the hierarchy.
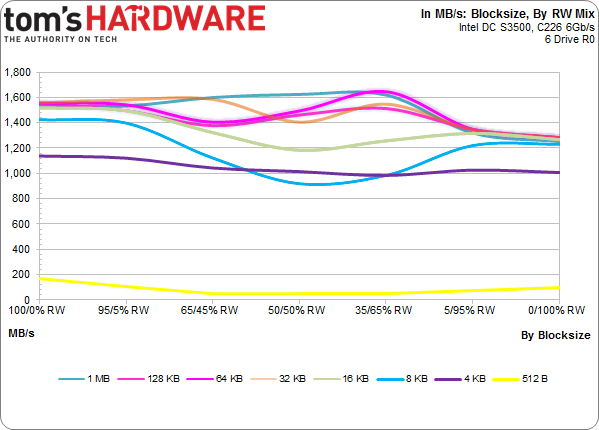
Instead of showing IOPS, this chart presents the data in bandwidth form. The larger block sizes generate less bandwidth and consume more CPU resources to create.
Getting back to the yellow line, 350,000 512-byte IOPS sound impressive, but that's only about 87 MB/s. It's not until we hit 32 KB accesses that the array starts touching its bandwidth limit around 1600 MB/s.
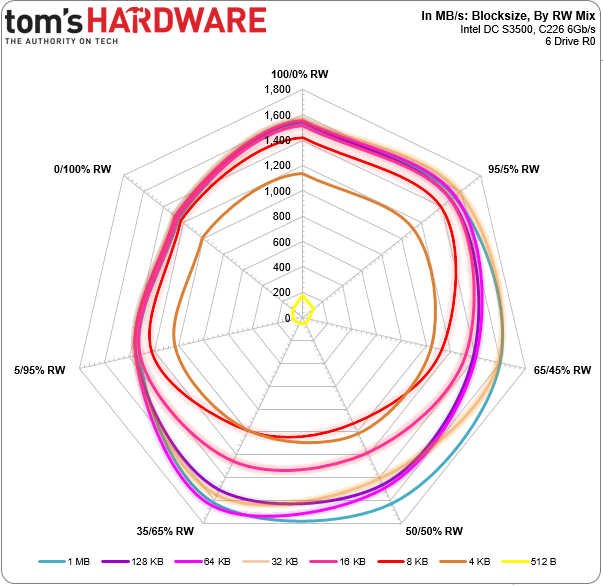
This radar graphic is just another way to visualize the data. Starting at the top with 100% reads, the various access blends get more write-heavy traveling clockwise. The 512-byte blocks are in the middle, pushing through the least amount of bandwidth, giving us that tiny yellow bulls-eye. The other block sizes form concentric rings (if you squint). Note that 0% read (or 100% write) is the lowest for all access sizes, while the middle 35/65% to 65/35% mix yields the most bandwidth in the larger blocks.
Current page: Mixing Block Sizes And Read/Write Ratios
Prev Page Results: A Second Look At RAID 5 Next Page Intel's Integrated Storage: New Hardware, New Software-
SteelCity1981 "we settled on Windows 7 though. As of right now, I/O performance doesn't look as good in the latest builds of Windows."Reply
Ha. Good ol Windows 7... -
vertexx In your follow-up, it would really be interesting to see Linux Software RAID vs. On-Board vs. RAID controller.Reply -
tripleX Wow, some of those graphs are unintelligible. Did anyone even read this article? Surely more would complain if they did.Reply -
utomo There is Huge market on Tablet. to Use SSD in near future. the SSD must be cheap to catch this huge market.Reply -
tripleX Wow, some of those graphs are unintelligible. Did anyone even read this article? Surely more would complain if they did.Reply -
tripleX Wow, some of those graphs are unintelligible. Did anyone even read this article? Surely more would complain if they did.Reply -
klimax "You also have more efficient I/O schedulers (and more options for configuring them)." Unproven assertion. (BTW: Comparison should have been against Server edition - different configuration for schedulers and some other parameters are different too)Reply
As for 8.1, you should have by now full release. (Or you don't have TechNet or other access?) -
rwinches " The RAID 5 option facilitates data protection as well, but makes more efficient use of capacity by reserving one drive for parity information."Reply
RAID 5 has distributed parity across all member drives. Doh!


